. 2009 Oct 19;4(10):e7526.
doi: 10.1371/journal.pone.0007526.

Genome-wide identification of transcription start sites, promoters and transcription factor binding sites in E. coli

Affiliations

Genome-wide identification of transcription start sites, promoters and transcription factor binding sites in E. coli

Alfredo Mendoza-Vargas et al. PLoS One. .

Abstract

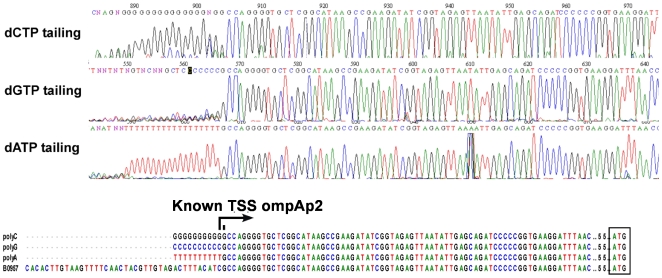
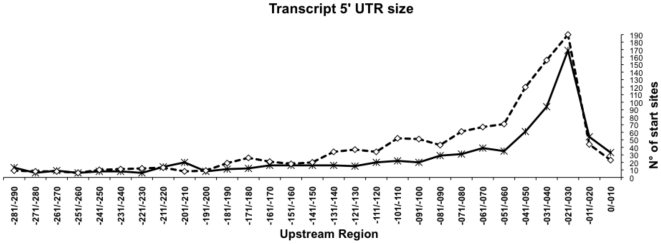
Despite almost 40 years of molecular genetics research in Escherichia coli a major fraction of its Transcription Start Sites (TSSs) are still unknown, limiting therefore our understanding of the regulatory circuits that control gene expression in this model organism. RegulonDB (http://regulondb.ccg.unam.mx/) is aimed at integrating the genetic regulatory network of E. coli K12 as an entirely bioinformatic project up till now. In this work, we extended its aims by generating experimental data at a genome scale on TSSs, promoters and regulatory regions. We implemented a modified 5' RACE protocol and an unbiased High Throughput Pyrosequencing Strategy (HTPS) that allowed us to map more than 1700 TSSs with high precision. From this collection, about 230 corresponded to previously reported TSSs, which helped us to benchmark both our methodologies and the accuracy of the previous mapping experiments. The other ca 1500 TSSs mapped belong to about 1000 different genes, many of them with no assigned function. We identified promoter sequences and type of sigma factors that control the expression of about 80% of these genes. As expected, the housekeeping sigma(70) was the most common type of promoter, followed by sigma(38). The majority of the putative TSSs were located between 20 to 40 nucleotides from the translational start site. Putative regulatory binding sites for transcription factors were detected upstream of many TSSs. For a few transcripts, riboswitches and small RNAs were found. Several genes also had additional TSSs within the coding region. Unexpectedly, the HTPS experiments revealed extensive antisense transcription, probably for regulatory functions. The new information in RegulonDB, now with more than 2400 experimentally determined TSSs, strengthens the accuracy of promoter prediction, operon structure, and regulatory networks and provides valuable new information that will facilitate the understanding from a global perspective the complex and intricate regulatory network that operates in E. coli.


Conflict of interest statement

Competing Interests: The authors have declared that no competing interests exist.

Figures

Figure 1
Figure 1. Directed Mapping of Transcription Start Sites (DMTSS).
a) Data selection using different databases in regulonDB; b) Rapid Amplification of cDNA Ends modified protocol. The key points to enhance the efficiency of the DMTSS protocol for massive TSSs mapping were: 1) selection of highly expressed TUs under specific growth conditions, and rational oligonucleotide design; 2) lineal amplification of cDNA; 3) PAGE separation and purification of PCR products and sequencing.
Figure 2
Figure 2. Analysis of different 3′ end polynucleotide incorporation efficiency.
A) Electropherograms show the incorporation of dCTP, dGTP, and dATP at the 3′ end of the cDNA for precise map the TSS of the ompA gene (ompAp2*) . dATP was the one that produced the most homogeneous tail. B) Sequence comparison shows the 5′ end of the different tailing reactions.
Figure 3
Figure 3. Mapping the TSS of the hns gene.
A) Proximal and distal oligonucleotides were designed to prime 38 and 155 nucleotides downstream of the ATG, respectively. B) The PCR products generated with each oligonucleotide primers were separated by PAGE and purified from the gel. C) Nucleotide sequence of each PCR band after excision from the gel. The nucleotide immediately before the polynucleotide tail corresponds to the TSS. D) Comparison of the nucleotide sequences obtained with the TSS previously reported .
Figure 4
Figure 4. Determination of the unknown TSSs for rpsB gene.
A) Proximal and distal oligonucleotides were design to prime 4 and 67 nucleotides downstream of the ATG, respectively. B) The PCR products generated with the oligonucleotide primers were separated by PAGE and purified from the gel. C) Nucleotide sequence of each PCR band after excision from the gel. The 3′ end the nucleotide immediately before the polynucleotide tail is the TSS. D) Comparison of the nucleotide sequences obtained with upstream region of rpsB.
Figure 5
Figure 5. Mapping the TSSs of the cysK gene.
A) The oligonucleotide primer was designed to prime 97 nucleotides downstream of the ATG. B) The A and B PCR products generated with the oligonucleotide primer were separated by PAGE and purified from the gel. C) Nucleotide sequence of each PCR band. The 3′ end the nucleotide immediately before the polynucleotide tail is the TSS. D) Comparison of the nucleotide sequences obtained with the upstream region. The previously reported TSS was located 34 nucleotides upstream from the ATG, while the new TSS was located at 67 nucleotides downstream.
Figure 6
Figure 6. TSSs mapping for three genes with no previously determined 5′ end, as examples of the 317 TSSs mapped in this work.
The TSSs for ychH (A), serS (B), and ycbB (C) genes, which code for a predicted inner membrane protein, a seryl-tRNA synthetase, and a predicted carboxypeptidase, respectively, were determined by DMTSS. The unique PCR fragments obtained by PCR for each gene were sequenced. The positions of the TSSs are indicated by arrows.
Figure 7
Figure 7. Number of TSSs per gene mapped.
Comparison of the TSSs obtained in this work with the ones in RegulonDB. Both data sets are very similar, indicating no bias in the genes selected in this work.
Figure 8
Figure 8. DMTSS results.
A) Multiple new TSSs were obtained for the kup gene, 57, 135, and 213 nucleotides upstream of the ATG. B) A new TSS for hybO was identified 26 nucleotides upstream of the ATG, plus the previously reported one at 102 nucleotides upstream of the ATG. C) For putP three TSSs out of five reported were mapped 17, 94, and 138 nucleotides upstream of the ATG.
Figure 9
Figure 9. Graphical representation of the E. coli chromosome region of the tig gene obtained with the GenoSeqGrapher V1.0 program.
Each pyrosequencing read is displayed as an arrow below the genomic DNA. Colors represent the different growth conditions from which the sequences were obtained. Mouse over the arrows displays a box with the nucleotide sequence, the position in the genome and the position with respect to ATG of the selected gene.
Figure 10
Figure 10. Display on the E. coli K-12 chromosome of all the TSSs obtained in this work by DMTSS (red) and by HTPS (black).
TSSs obtained by both methodologies are shown in blue.
Figure 11
Figure 11. Multiple TSSs for a single TU.
The graph shows several sequences upstream of the csrB and cspA genes initiating at different positions, showing the ambiguity of the TSS in some TU.
Figure 12
Figure 12. Frequency of each initiation nucleotide.
The graph shows the frecuency of the starting nucleotide (adenine, guanine, cytosine and thymine) TSSs obtained by DMTSS, by HTPS, and for the TSSs with predicted promoters from the HTPS data set. AGCT in DMTSS indicates any nucleotide, see text.
Figure 13
Figure 13. Distance of the predicted TF binding sites to the TSSs described in Table S1.
Data obtained in this work were compared with that of RegulonDB.
Figure 14
Figure 14. Length of the 5′ untranslated region (5′ UTR).
The distances of each TSS mapped to the ATG translation initiation codon is plotted (5′ UTR). Dataset obtained in this work (solid line), and in all the previously mapped TSSs in RegulonDB (dashed line). For both data sets the most frequent 5′ UTR length was between 20 to 40 nucleotides.

References

    1. Brenner S, Johnson M, Bridgham J, Golda G, Lloyd DH, et al. Gene expression analysis by massively parallel signature sequencing (MPSS) on microbead arrays. Nat Biotechnol. 2000;18:630–634. - PubMed
    1. Liang P, Pardee AB. Differential display of eukaryotic messenger RNA by means of the polymerase chain reaction. Science. 1992;257:967–971. - PubMed
    1. Roth ME, Feng L, McConnell KJ, Schaffer PJ, Guerra CE, et al. Expression profiling using a hexamer-based universal microarray. Nat Biotechnol. 2004;22:418–426. - PubMed
    1. Saha S, Sparks AB, Rago C, Akmaev V, Wang CJ, et al. Using the transcriptome to annotate the genome. Nat Biotechnol. 2002;20:508–512. - PubMed
    1. Velculescu VE, Zhang L, Vogelstein B, Kinzler KW. Serial analysis of gene expression. Science. 1995;270:484–487. - PubMed

Publication types

Substances

LinkOut - more resources