. 2010 May;12(3):173-86.
doi: 10.1016/j.ymben.2009.10.003. Epub 2009 Oct 17.

Model-driven evaluation of the production potential for growth-coupled products of Escherichia coli

Affiliations

Model-driven evaluation of the production potential for growth-coupled products of Escherichia coli

Adam M Feist et al. Metab Eng. 2010 May.

Abstract

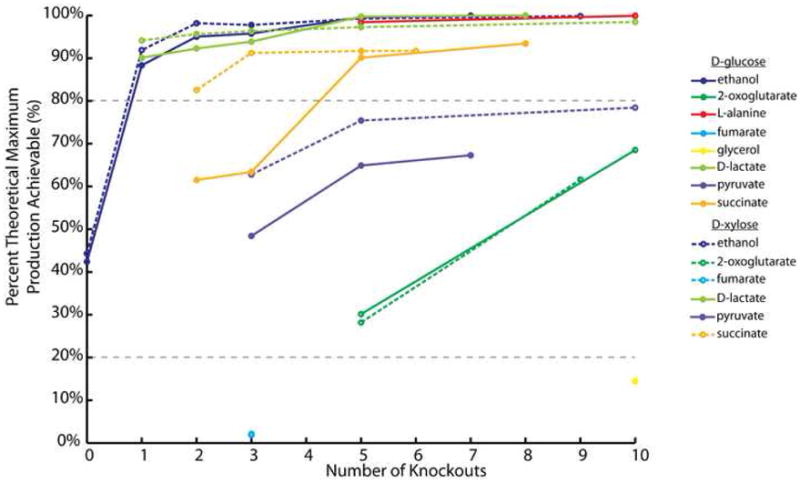
Integrated approaches utilizing in silico analyses will be necessary to successfully advance the field of metabolic engineering. Here, we present an integrated approach through a systematic model-driven evaluation of the production potential for the bacterial production organism Escherichia coli to produce multiple native products from different representative feedstocks through coupling metabolite production to growth rate. Designs were examined for 11 unique central metabolism and amino acid targets from three different substrates under aerobic and anaerobic conditions. Optimal strain designs were reported for designs which possess maximum yield, substrate-specific productivity, and strength of growth-coupling for up to 10 reaction eliminations (knockouts). In total, growth-coupled designs could be identified for 36 out of the total 54 conditions tested, corresponding to eight out of the 11 targets. There were 17 different substrate/target pairs for which over 80% of the theoretical maximum potential could be achieved. The developed method introduces a new concept of objective function tilting for strain design. This study provides specific metabolic interventions (strain designs) for production strains that can be experimentally implemented, characterizes the potential for E. coli to produce native compounds, and outlines a strain design pipeline that can be utilized to design production strains for additional organisms.


Figures

Figure 1
Figure 1. Strain Design Selection: Secondary objective criteria
Graphs showing (a) the production envelopes of the different secondary objective functions examined for designing strains, and (b) the different types of production envelopes encountered during this analysis. Also shown is a schematic of the direction of optimization for the ‘tilted’ and ‘non-tilted’ objective functions used in the analyses and points on the production envelopes each will score.
Figure 2
Figure 2. Problem Formulation: Reduction of model and selection of targeted reactions
Method used to acquire target reactions for deletion from the E. coli genome and to reduce computation time. For the six steps, four are based off biological assumptions and two are computational approaches.
Figure 3
Figure 3. Strain design pipeline: the process used to compute strain designs for growth-coupled production in E. coli
This workflow outlines the process developed to generate the strain designs for the analysis and the results at various points in the process. Each colored box represents a computation (violet), substrate or target definition (green), or filtering or analysis of results generated during the procedure (red). Starting on the left, the substrate conditions were defined to produce substrate-specific model and the reactions targeted for elimination in the analysis. From here, targets were defined and the OptKnock (Burgard et al., 2003) algorithm was first used to examine lower knockout number maximum yield designs. Using the results from this analysis, designs were fed into simulations with the OptGene (Patil et al., 2005) algorithm along with results from a testing design pool. OptGene simulation results examined maximum yield, substrate-specific productivity (SSP), and strength of growth coupling (SOC) for up to ten reaction knockouts. Results from different time points in the analysis are given on the bottom. Additionally, reactions that contributed to designs were compared to the initial targets for comparison.
Figure 4
Figure 4. The strain designs generated for five different targets from glucose and xylose anaerobically
A set of graphs that give the production envelopes for different substrate/target pairs that were calculated during the analysis under anaerobic conditions. The different target production rates (mmol gDW−1 hr−1) are shown on the y-axis and the growth rate (hr−1) is given on the x-axis. Shown on each plot (if a solution exists) are the maximum yields, Yp/s, for 3 knockouts (yellow, solid line), 5 knockouts (green, solid line), up to 10 knockouts (with a 99.99% deletion penalty, blue, solid line), the maximum substrate-specific productivity (SSP, pink, dashed line), and the maximum strength of growth coupling (SOC, orange, dashed line) design. For example, there are no valid solutions for L-alanine production on xylose given the minimum growth rate of 0.1 hr−1.
Figure 5
Figure 5. Theoretical maximum production achievable for different substrate/target pairs for under anaerobic conditions
A plot of the percent theoretical maximum production achievable for different substrate (top of column) and target (listed) combinations as a function of number of knockouts allowed to the system. Each point is the maximum value for a given number of knockouts. The plot contains the data from examining growth of E. coli under anaerobic conditions. The lowest number of knockouts for a design can be coupled to growth is the leftmost point for each substrate/target pair. Also shown are the cutoffs (20% and 80%) that delineate the three different categories of designs. The plot characterizes the relationship between the number of knockouts necessary to growth couple a product and achievable production. A number of products can be generated from three knockouts very near to the maximum production achievable.

References

    1. Werpy T, Petersen G, editors. Top Value Added Chemicals from Biomass. U.S. Department of Energy; 2004.
    1. Altaras NE, Cameron DC. Metabolic engineering of a 1,2-propanediol pathway in Escherichia coli. Appl Environ Microbiol. 1999;65:1180–5. - PMC - PubMed
    1. Atsumi S, Liao JC. Metabolic engineering for advanced biofuels production from Escherichia coli. Curr Opin Biotechnol 2008 - PMC - PubMed
    1. Baba T, et al. Construction of Escherichia coli K-12 in-frame, single-gene knockout mutants: the Keio collection. Mol Syst Biol. 2006;2:2006.0008. - PMC - PubMed
    1. Bailey JE. Toward a science of metabolic engineering. Science. 1991;252:1668–75. - PubMed

Publication types

LinkOut - more resources