. 2009 Dec 18;284(51):35632-44.
doi: 10.1074/jbc.M109.055194.

Genetic ablation of calcium-independent phospholipase A2{gamma} leads to alterations in hippocampal cardiolipin content and molecular species distribution, mitochondrial degeneration, autophagy, and cognitive dysfunction

Affiliations

Genetic ablation of calcium-independent phospholipase A2{gamma} leads to alterations in hippocampal cardiolipin content and molecular species distribution, mitochondrial degeneration, autophagy, and cognitive dysfunction

David J Mancuso et al. J Biol Chem. .

Abstract

Genetic ablation of calcium-independent phospholipase A(2)gamma (iPLA(2)gamma) results in profound alterations in hippocampal phospholipid metabolism and mitochondrial phospholipid homeostasis resulting in enlarged and degenerating mitochondria leading to autophagy and cognitive dysfunction. Shotgun lipidomics demonstrated multiple alterations in hippocampal lipid metabolism in iPLA(2)gamma(-/-) mice including: 1) a markedly elevated hippocampal cardiolipin content with an altered molecular species composition characterized by a shift to shorter chain length molecular species; 2) alterations in both choline and ethanolamine glycerophospholipids, including a decreased plasmenylethanolamine content; 3) increased oxidized phosphatidylethanolamine molecular species; and 4) an increased content of ceramides. Electron microscopic examination demonstrated the presence of enlarged heteromorphic lamellar structures undergoing degeneration accompanied by the presence of ubiquitin positive spheroid inclusion bodies. Purification of these enlarged heteromorphic lamellar structures by buoyant density centrifugation and subsequent SDS-PAGE and proteomics identified them as degenerating mitochondria. Collectively, these results identify the obligatory role of iPLA(2)gamma in neuronal mitochondrial lipid metabolism and membrane structure demonstrating that iPLA(2)gamma loss of function results in a mitochondrial neurodegenerative disorder characterized by degenerating mitochondria, autophagy, and cognitive dysfunction.


Figures

FIGURE 1.
FIGURE 1.
Northern analysis of iPLA2γ mRNA in wild type and its absence in the iPLA2γ−/− mouse brain. Northern blot analysis using RNA isolated from cortex, cerebellum, hippocampus, and brain stems of wild-type (W) and iPLA2γ−/− (K) are shown using a [32P]dCTP-labeled 2-kb iPLA2γ cDNA (iPLA2γ) probe that flanks the region encoding the lipase active site. Hybridization with a glyceraldehyde-3-phosphate dehydrogenase (GAPDH) probe in each corresponding lane is shown for comparison. Results are representative of separate Northern analyses of RNA extracted from multiple tissues of three WT and three iPLA2γ−/− male animals 6–8 months of age.
FIGURE 2.
FIGURE 2.
Altered levels of cardiolipin molecular species in the hippocampus of iPLA2γ−/− mice. A, hippocampal lipid extracts of wild-type and iPLA2γ−/− mice were prepared using a modified Bligh and Dyer procedure. Negative ion electrospray ionization mass spectra were acquired using a QqQ mass spectrometer as described under “Experimental Procedures.” Equal amounts of a spiked CL internal standard (tetra 14:0 CL ([M+1]2− isotopologue at m/z 619.9) were added to each sample, and spectra were normalized to the intensity of the CL internal standard (not shown)). Peak heights represent the relative intensity (%) of the individual molecular species to the intensity of the CL internal standard. The asterisks indicate doubly charged CL plus-one isotopologues whose ion peak intensities were utilized to quantify individual CL molecular species as described previously (37, 78). The results indicate an increase in multiple CL species in the iPLA2γ−/− mice and especially those containing shorter chain length aliphatic chains. B, the levels of total CL molecular species were calculated in comparison with internal standard after 13C deisotoping as described previously (37, 78). A 1.5-fold increase in total cardiolipin content was observed in the iPLA2γ−/− hippocampus in comparison to WT littermates (Total CL, p < 0.05). C, a nearly 2-fold increase in a major arachidonyl-containing CL species (20:4–20:4–18:1–18:1) was observed (20:4 CL, p < 0.02). D, the majority of the increase in total CL was due to a 3-fold increase in the proportion of low molecular weight cardiolipin species (<720 CL, p < 0.002). All experiments were performed with four male WT and iPLA2γ−/− mice between 7 and 10 months of age.
FIGURE 3.
FIGURE 3.
Alterations in hippocampal choline and ethanolamine glycerophospholipid (PC and PE) molecular species. Mouse hippocampal tissues were obtained from wild-type or iPLA2γ−/− mice fed ad libitum. The same hippocampal lipid extracts as those used in Fig. 2 were subjected to ESI/MS analyses in both the positive-ion and negative-ion modes in the presence of a small amount of LiOH as described under “Experimental Procedures.” Spectra were normalized to the internal standards at m/z 680.6 for PC (A) and at m/z 686.5 for PE (B) and are represented as relative intensity (%) of the highest peak at m/z 766.7 in A and the highest peak at m/z 790.6 in B for direct comparison between WT and KO spectra. A, a 1.5-fold increase in arachidonyl-containing PC species indicated by asterisks was observed in the iPLA2γ−/− mice in comparison to WT littermates (p < 0.02). B, major PE plasmalogen species are indicated by brackets in the spectra. A 30% decrease in PE plasmalogen content was observed in the iPLA2γ−/− mice (p < 0.001) along with a nearly 2-fold increase in D18:0–20:4 PE species (p < 0.001). All experiments were performed with male WT and iPLA2γ−/− mice between 7 and 10 months of age.
FIGURE 4.
FIGURE 4.
Alterations in hippocampal ceramide lipid molecular species. The same lipid extracts described in Figs. 2 and 3 were diluted in chloroform/methanol and directly infused into an ESI ion source for ESI/tandem MS analyses as described under “Experimental Procedures.” Spectra were normalized to internal standards and represented as the relative intensity (%) of the internal standard peak for direct comparisons between WT (upper panel) and KO (lower panel) spectra. A 25% increase in total ceramide content was observed in the iPLA2γ−/− (KO, p < 0.05, bar graph) compared with wild-type controls (WT) with most of the increase due to an increase in 18:0 molecular species at m/z 564.7 (p = 0.02); n = 3 per group. All experiments were performed with male WT and iPLA2γ−/− mice between 7 and 10 months of age.
FIGURE 5.
FIGURE 5.
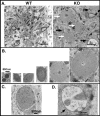
Transmission electron micrographs of morphologic abnormalities in the hippocampi of iPLA2γ−/− mice. A, images from transmission electron microscopy performed on sections from hippocampi of 10-month-old iPLA2γ−/− male mice (right) illustrate a diverse array of alterations in cellular ultrastructure, including heteromorphic structures with the presence of degenerating mitochondrial remnants and markedly enlarged mitochondria in comparison to WT control sections (left). Solid arrows indicate structures identifiable as mitochondria on the basis of size and the presence of cristae. Open arrows identify structures with features of both mitochondria and membranous bodies. B, a series of images illustrating the range of mitochondrial and mitochondrial-like membranous body sizes observed in iPLA2γ−/− hippocampus. Numerous enlarged structures had an onion-like appearance with concentric whorls of membranous material. C, electron micrograph of a dystrophic axon in iPLA2γ−/− mice showing the presence of tubulovesicular elements with a “typical cleft” similar to lesions previously seen in the iPLA2β−/− mouse (16). These clefts typically are admixed with sheets of membrane that are sometimes found in stacked or whorled arrangements. D, an example of a morphologic structure that has characteristics of an autophagosome (arrow). Microscopists were blinded to the identity of the analyzed groups; n = 3 per group.
FIGURE 6.
FIGURE 6.
Spheroid formation in discrete brain regions present in iPLA2γ−/− mice. Although the iPLA2γ−/− brain appeared normal by gross anatomical examination, and hematoxylin and eosin staining did not reveal apparent differences relative to WT, immunohistologic staining for ubiquitin in brain regions from 10- to 12-month-old male iPLA2γ−/− animals revealed numerous small ubiquitin-positive inclusions (arrows) in the internal capsule (A), molecular layer of the dentate gyrus in the hippocampus (B), polymorphic layer of the dentate gyrus in the hippocampus (C), and the spinal cord gray matter (D). In parallel studies, spheroids were rarely observed in WT brains (not shown). Immunostaining was labeled with a brown chromogen. Nuclei were stained with a hematoxylin counterstain. The bar represents 10 μm.
FIGURE 7.
FIGURE 7.
Transmission electron micrographs of hippocampal mitochondrial fractions. Hippocampal tissue from WT and iPLA2γ−/− mice were dissected, homogenized, and centrifuged to obtain a 7000 × g mitochondrial fraction. This fraction was then subjected to discontinuous sucrose gradient centrifugation and the bands at the 32 and 60% sucrose interfaces were collected as described under “Experimental Procedures.” After dilution in homogenization buffer and centrifugation at 10,000 × g, 3% glutaraldehyde in cacodylate buffer was then added to the resultant pellets for subsequent analyses by transmission electron microscopy. A, electron microscopy of the 60% sucrose fractions from WT and iPLA2γ−/− (KO) samples illustrating the presence of multilaminar mitochondrial structures in the hippocampus of the iPLA2γ−/− mouse. B, representative material from the 32% sucrose interface from WT and iPLA2γ−/− mitochondrial pellets illustrating dramatic differences in organellar size and morphology; n = 3 per group. All experiments were performed with male WT and iPLA2γ−/− mice between 10 and 12 months of age.
FIGURE 8.
FIGURE 8.
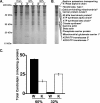
Proteomic and lipidomic analyses of the iPLA2γ−/− mitochondrial fraction from hippocampus. Hippocampal tissue was homogenized and centrifuged to obtain a 7000 × g mitochondrial fraction that was then loaded onto a discontinuous sucrose gradient. A, the mitochondrial fractions collected from the homogenate (Hom), 32 and 60% sucrose cushions of wild-type (W), and iPLA2γ−/− (K) hippocampus were subjected to SDS-PAGE and stained with Coomassie Brilliant Blue. Note the similarities in the protein-banding pattern of the 32% iPLA2γ−/− fraction with those of the 60% WT and iPLA2γ−/− fractions. B, for proteomic analyses, individual bands from the iPLA2γ−/− 32% fraction were excised, destained, and trypsinized to obtain peptides that were then subjected to MALDI MS analysis and data-dependent tandem MS as described under “Experimental Procedures.” A summary of identified proteins and their corresponding bands by SDS-PAGE is illustrated with established mitochondrial markers indicated by asterisks. C, total cardiolipin content of the 32 and 60% sucrose fractions from WT (closed bars) and iPLA2γ−/− (open bars) hippocampal mitochondria. Negative ion ESI/MS were acquired using a QqQ mass spectrometer for quantitation of cardiolipin species as described under “Experimental Procedures.” Note the significant decrease in CL present in the iPLA2γ−/− 60% sucrose interface (normal mitochondria) and an increase in CL content of the iPLA2γ−/− 32% sucrose interface (light mitochondria) relative to WT. Lanes represent total cardiolipin in the 60 and 32% sucrose fractions of wild-type (W) or iPLA2γ−/− (K) hippocampal mitochondria. All experiments were performed with male wild-type and iPLA2γ−/− mice between 10 and 12 months of age.
FIGURE 9.
FIGURE 9.
Cardiolipin and protein mitochondrial markers in hippocampal mitochondrial fractions. A, hippocampi from wild-type (WT) and iPLA2γ−/− (KO) were dissected and homogenized, and mitochondrial fractions were isolated using a discontinuous sucrose gradient. Lipidomic analyses were performed using ESI/MS as described in detail under “Experimental Procedures.” The total ion intensity of individual CL molecular species was calculated as previously described (53) based upon peak intensities of doubly charged plus-one isotopologues and the theoretical 13C isotopic distribution. Multiple alterations in cardiolipin species mass and distribution were observed in the 60% fraction and 32% fraction isolated from WT and KO mice. The identities of the major individual species m/z (identified as described in Ref. 2) are as follows: 1, 700.49 (18:1–18:1–16:0–16;1); 2, 701.49 (18:1–18:1–16:0–16:0); 3, 711.48 (20:4–18:1–16:1–16:0); 4, 712.49 (18:2–18:1–18:1–16:0); 5, 713.49 (18:1–18:1–18:1–16:1); 6, 714.5 (18:1–18:1–18:1–16:0); 7, 723.48 (20:4–18:2–18:1–16:1); 8, 724.49 (20:4–18:2–18:1–16:0); 9, 725.49 (20:4–18:1–18:1–16:0); 10, 726.5 (18:2–18:1–18:1–18:1); 11, 727.51 (tetra 18:1); 12, 735.48 (20:4–20:4–18:1–16:1); 13, 736.49 (20:4–20:4–18:1–16:0); 14, 737.49 (20:4–18:2–18:1–18:1); 15, 738.5 (20:4–18:1–18:1–18:1); 16, 747.4820:4–20:4–18:2–18:2); 17, 748.49 (20:4–20:4–18:2–18:1); 18, 749.49 (20:4–20:4–18:1–18:1); 19, 750.5 (22:6–18:1–18:1–18:1); 20, 760.49 (22:6–20:4–18:2–18:1); 21, 761.49 (22:6–20:4–18:1–18:1), 22, 762.5 (22:6–20:4–18:1–18:0); 23, 772.49 (22:6–20:4–20:4–18:1); and 24, 773.49 (22:6–22:6–18:1–18:1). All experiments were performed with 8-month-old male WT and iPLA2γ−/− mice. B, Western analysis of WT and iPLA2γ−/− hippocampal homogenates and sucrose density gradient fractions for the mitochondrial markers porin and COX IV. Western analysis was performed on hippocampal tissue homogenates and isolated mitochondrial fractions (10 μg/lane) from 8-month-old WT and iPLA2γ−/− male mice. Anti-porin and anti-COX IV antibodies were used to visualize porin and COX IV following incubation with horseradish peroxidase-conjugated secondary reagents as described under “Experimental Procedures.” Homog = homogenate (WT) and iPLA2γ−/− (KO); 32% - 7000g = mitochondria present at the 32% sucrose interface after 7000 × g centrifugation of the WT and KO homogenates; 60% - 7000g = mitochondria present at the 60% sucrose interface after 7000 × g centrifugation of the WT and KO homogenates; arrows indicate the locations of bands corresponding to porin or COX IV. Results are representative of three separate Western analyses.
FIGURE 10.
FIGURE 10.
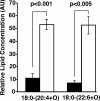
Increase in oxidized PE molecular species in the hippocampus from iPLA2γ−/− mice. Oxidized PE molecular species from WT (closed bars) and iPLA2γ−/− (open bars) hippocampal lipid extracts were identified by ESI/MS and quantified using multiple reaction monitoring (MRM) and presented as the relative lipid concentration in arbitrary units (AU). Oxidized PE species ([18:0-(20:4+O) and 18:0-(22:6+O)) were determined using MRM in the negative ion mode for WT (closed bars) and iPLA2γ−/− (open bars) normalized to a PE internal standard. Quantification was performed by comparison of the intensities of MRM for oxidized species with those of the PE internal standard. All experiments were performed with four WT and iPLA2γ−/− mice between 7 and 8 months of age; n = 3 per group.
FIGURE 11.
FIGURE 11.
Spatial learning and memory deficits in iPLA2γ−/− mice in the Morris water navigation test. A, acquisition performance during place trials iPLA2γ−/− mice (open squares) demonstrated impaired acquisition (spatial learning) performance by exhibiting significantly longer escape path lengths versus WT controls (closed circles) across the blocks of trials (, p = 0.002). Groups differed significantly beyond Bonferroni correction in blocks 2, 3, and 5 (*, p < 0.009) and in block 4 (#, p < 0.02). B, swimming performance during place trials. iPLA2γ−/− mice had significantly reduced swim speeds versus WT controls (, p < 0.0001), where differences exceeded Bonferroni correction for blocks 1, 2, 4, and 5 (*, p < 0.004) and for block 3 (#, p < 0.02). C, cued trials performance. Mice were evaluated in the cued trials before conducting the place trials to assess the presence of compromised nonassociative functions in the mice that might affect subsequent acquisition performance during the place condition. An analysis of variance on the path length data yielded a significant genotype by blocks of trials interaction (p = 0.028), but subsequent pairwise comparisons showed that the groups did not differ during the cued trials except for Block 4 when the iPLA2γ−/− mice (open squares) had significantly longer path lengths compared with the WT (closed circles) controls (*, p = 0.001). D, assessing retention of the precise platform location during the probe trial. iPLA2γ−/− mice (open bar) had significantly fewer platform crossings than WT (closed bar) controls (p = 0.003) suggesting that the iPLA2γ−/− mice were impaired in terms of retaining an exact location of the platform. E, determination of time in the pool quadrants to assess retention performance. iPLA2γ−/− mice also exhibited impaired probe trial performance in terms of a more generalized retention of the platform location by spending significantly less time in the target (TGT) quadrant compared with WT mice (p = 0.04). The retention deficits in the iPLA2γ−/− mice were further documented by comparisons with WT mice that showed a spatial bias for the TGT quadrant and spent significantly (*, p < 0.007) more time in it compared with quadrants that were to the right (RGT), left (LFT), or opposite (OPP) the target quadrant, whereas the iPLA2γ−/− mice showed no such spatial bias. All experiments were performed with 10 WT and 9 iPLA2γ−/− mice at 4 months of age.

References

    1. Kann O., Kovács R. (2007) Am. J. Physiol. Cell Physiol. 292, C641–C657 - PubMed
    1. Dawson T. M., Dawson V. L. (2003) Science 302, 819–822 - PubMed
    1. Schon E. A., Manfredi G. (2003) J. Clin. Invest. 111, 303–312 - PMC - PubMed
    1. Lin M. T., Beal M. F. (2006) Nature 443, 787–795 - PubMed
    1. Keil U., Bonert A., Marques C. A., Scherping I., Weyermann J., Strosznajder J. B., Müller-Spahn F., Haass C., Czech C., Pradier L., Müller W. E., Eckert A. (2004) J. Biol. Chem. 279, 50310–50320 - PubMed

Publication types

MeSH terms

Substances