. 2009 Dec 11;284(50):35215-26.
doi: 10.1074/jbc.M109.056184. Epub 2009 Oct 19.

Cation-independent mannose 6-phosphate receptor: a composite of distinct phosphomannosyl binding sites

Affiliations

Cation-independent mannose 6-phosphate receptor: a composite of distinct phosphomannosyl binding sites

Richard N Bohnsack et al. J Biol Chem. .

Abstract

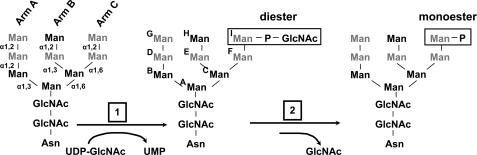
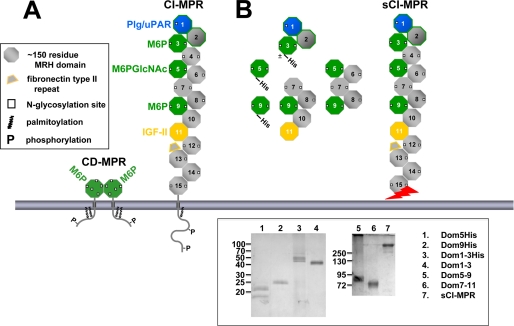
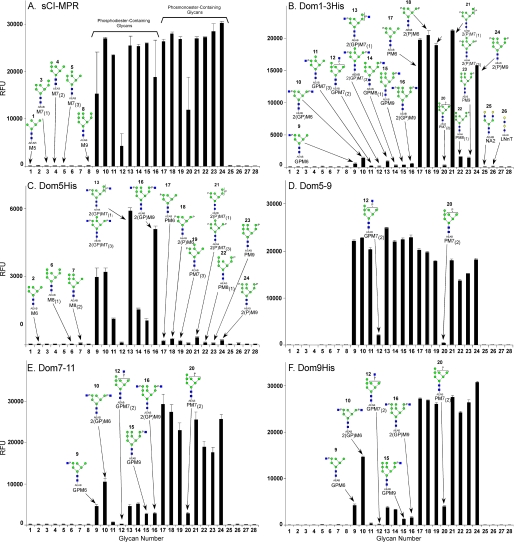
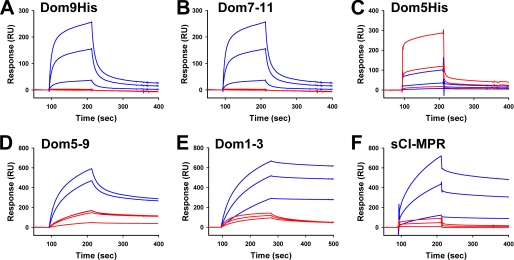
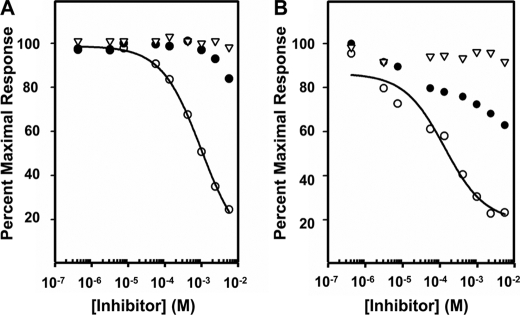
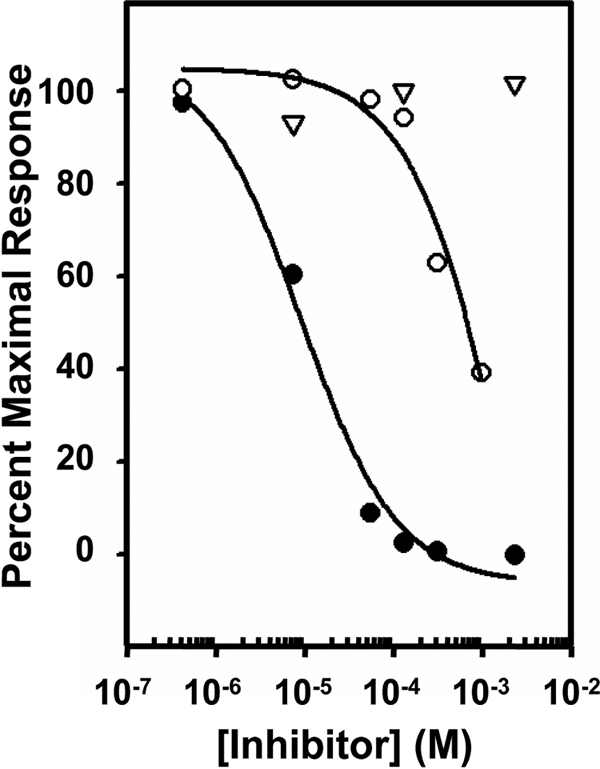
The 300-kDa cation-independent mannose 6-phosphate receptor (CI-MPR), which contains multiple mannose 6-phosphate (Man-6-P) binding sites that map to domains 3, 5, and 9 within its 15-domain extracytoplasmic region, functions as an efficient carrier of Man-6-P-containing lysosomal enzymes. To determine the types of phosphorylated N-glycans recognized by each of the three carbohydrate binding sites of the CI-MPR, a phosphorylated glycan microarray was probed with truncated forms of the CI-MPR. Surface plasmon resonance analyses using lysosomal enzymes with defined N-glycans were performed to evaluate whether multiple domains are needed to form a stable, high affinity carbohydrate binding pocket. Like domain 3, adjacent domains increase the affinity of domain 5 for phosphomannosyl residues, with domain 5 exhibiting approximately 60-fold higher affinity for lysosomal enzymes containing the phosphodiester Man-P-GlcNAc when in the context of a construct encoding domains 5-9. In contrast, domain 9 does not require additional domains for high affinity binding. The three sites differ in their glycan specificity, with only domain 5 being capable of recognizing Man-P-GlcNAc. In addition, domain 9, unlike domains 1-3, interacts with Man(8)GlcNAc(2) and Man(9)GlcNAc(2) oligosaccharides containing a single phosphomonoester. Together, these data indicate that the assembly of three unique carbohydrate binding sites allows the CI-MPR to interact with the structurally diverse phosphorylated N-glycans it encounters on newly synthesized lysosomal enzymes.


Figures

FIGURE 1.
FIGURE 1.
Modification of N-glycans on lysosomal enzymes. Phosphorylation of mannose residues on lysosomal enzymes' N-linked oligosaccharides is carried out by the GlcNAc phosphotransferase, which transfers GlcNAc-1-phosphate from UDP-GlcNAc to the C-6 hydroxyl group of mannose to form a Man-P-GlcNAc phosphodiester. The N-glycans can be further modified by the uncovering enzyme, which removes the GlcNAc moiety to expose the Man-6-P phosphomonoester. The five potential sites of mannose phosphorylation are indicated in gray. The three arms of the N-glycan are labeled and their mannose residues designated A–I are shown.
FIGURE 2.
FIGURE 2.
Man-6-P binding sites of the CI-MPR. A, schematic diagram of the full-length CI-MPR and CD-MPR. The MPRs are type I integral membrane glycoproteins, each with an N-terminal signal sequence, an extracytoplasmic region, a single transmembrane region, and a C-terminal cytoplasmic domain. The CI-MPR has a large extracytoplasmic region comprised of 15 contiguous domains, each ∼150 residues in length. The location of the Man-6-P and IGF-II binding sites are indicated. B, the truncated CI-MPR constructs used in this study are shown. Constructs that contain a C-terminal tag of six histidine residues are indicated. The sCI-MPR was purified from fetal bovine serum. The jagged arrow indicates that the C terminus of the sCI-MPR is not defined as this soluble form of the receptor is generated by proteolysis (62, 63). Inset, purified proteins were resolved on 12 (left panel) or 7.5% (right panel) nonreducing SDS-polyacrylamide gels and visualized by silver staining. The two bands observed for the Dom5His construct (lane 1) represent glycosylated (21 kDa) and non-glycosylated (18 kDa) species as determined by endoglycosidase H digestion (data not shown). The slower mobility of the P. pastoris-derived Dom1–3His construct (lane 3, 45–50 kDa) compared with the Sf9-derived Dom1–3 construct (lane 4, 43 kDa) is due to the presence of the six histidine residues and the larger (Man8-Man12) N-glycans produced in P. pastoris (36) compared with the smaller Man3GlcNAc2 N-glycans typically produced in Sf9 insect cells (36).
FIGURE 3.
FIGURE 3.
Interaction of CI-MPR constructs with the phosphorylated glycan microarray. The phosphorylated glycan microarray was printed as described in the accompanying article (64) and the individual glycans are identified by their glycan number (glycan number) as indicated in Table 1 of the accompanying article (64). Glycans 1–8 are non-phosphorylated high mannose-type oligosaccharides; 9–16, phosphodiesters of high mannose-type oligosaccharides; and 17–24, phosphomonoesters of high mannose-type oligosaccharides. The structural assignments are made according to Table 1 in the accompanying article (64) and are shown in Fig. 3. CI-MPR constructs were applied to the array at 50 μg/ml and detected with polyclonal rabbit antibody 14.5 as described under “Experimental Procedures.” A, sCI-MPR is the same data shown in Fig. 4D of the accompanying article (64); B, Dom1–3; C, Dom5; D, Dom5–9; E, Dom7–11; and F, Dom9. Error bars represent the mean ± S.D. of 6 replicates after removing the high and low values.
FIGURE 4.
FIGURE 4.
SPR analysis of MPR constructs binding to GAA phosphomonoester or GAA phosphodiester. Similar amounts (2500 and 2300 response units, respectively) of GAA monoester and GAA diester were immobilized on the surface of a CM5 sensor chip (panels A–D and F). MPR constructs were injected in a volume of 80 μl over the coupled and reference flow cells at a rate of 40 μl/min. After 2 min, the solutions containing the MPRs were replaced with buffer and the complexes allowed to dissociate for 3 min. Shown are representative sensorgrams for: A, Dom9His at 10 nm, 100 nm, and 1 μm; B, Dom7–11 at 10 nm, 100 nm, and 1 μm; C, Dom5His at 10 nm, 100 nm, and 1 μm; D, Dom5–9 at 10 nm, 100 nm, and 1 μm; and F, sCI-MPR at 10 nm, 100 nm, and 1 μm comparing the response on GAA phosphomonoester (blue lines) and GAA phosphodiester (red lines) surfaces. E, Dom1–3 was immobilized on the surface of a CM5 sensor chip and GAA monoester or GAA diester were injected in a volume of 80 μl over the Dom1–3 and reference flow cells at a rate of 40 μl/min. After 3 min, the solutions containing the GAA lysosomal enzymes were replaced with buffer and the complexes were allowed to dissociate for 3 min. Shown are representative sensorgrams of the GAA phosphomonoester (blue lines) and GAA phosphodiester (red lines) at 10 nm, 100 nm, and 1 μm. Kinetic parameters were determined by global fitting of the sensorgrams to a 1:1 binding model using BIAevaluation version 4.0.1 software and summarized in Table 1.
FIGURE 5.
FIGURE 5.
Inhibition of Dom5His and Dom5–9 binding to GAA by Man-6-P, Glc-6-P, and N-acetylglucosaminyl 6-phosphomethylmannoside diester. Aliquots of 500 nm Dom5His (A) and 50 nm Dom5–9 (B) were incubated with increasing concentrations of Glc-6-P (▿), Man-6-P (●), or N-acetylglucosaminyl 6-phosphomethylmannoside diester (○) and injected over a flow cell coupled with GAA diester. The Req from the resulting sensorgrams was plotted as a percent of the maximal response against the log of the inhibitor concentration. The Ki was determined using nonlinear regression (SigmaPlot, version 10.0).
FIGURE 6.
FIGURE 6.
Inhibition of Dom1–3 binding to GAA by Man-6-P, Glc-6-P, and N-acetylglucosaminyl 6-phosphomethylmannoside diester. Aliquots of 20 nm GAA diester were incubated with increasing concentrations of Glc-6-P (▿), Man-6-P (●), or N-acetylglucosaminyl 6-phosphomethylmannoside diester (○) and injected over a flow cell coupled with Dom1–3. The Req was plotted against the log of the inhibitor concentration. The Ki was determined using nonlinear regression (SigmaPlot, version 10.0).

Similar articles

Cited by

References

    1. Ghosh P., Dahms N. M., Kornfeld S. (2003) Nat. Rev. Mol. Cell Biol. 4, 202–212 - PubMed
    1. Mullins C., Bonifacino J. S. (2001) Bioessays 23, 333–343 - PubMed
    1. Dell'Angelica E. C., Payne G. S. (2001) Cell 106, 395–398 - PubMed
    1. Hasilik A., Klein U., Waheed A., Strecker G., von Figura K. (1980) Proc. Natl. Acad. Sci. U.S.A. 77, 7074–7078 - PMC - PubMed
    1. Varki A., Kornfeld S. (1980) J. Biol. Chem. 255, 10847–10858 - PubMed

Publication types

LinkOut - more resources