. 2009 Oct 26;206(11):2483-96.
doi: 10.1084/jem.20091046. Epub 2009 Oct 19.

Prospective identification, isolation, and systemic transplantation of multipotent mesenchymal stem cells in murine bone marrow

Affiliations

Prospective identification, isolation, and systemic transplantation of multipotent mesenchymal stem cells in murine bone marrow

Satoru Morikawa et al. J Exp Med. .

Abstract

Mesenchymal stem cells (MSCs) are defined as cells that undergo sustained in vitro growth and can give rise to multiple mesenchymal lineages. Because MSCs have only been isolated from tissue in culture, the equivalent cells have not been identified in vivo and little is known about their physiological roles or even their exact tissue location. In this study, we used phenotypic, morphological, and functional criteria to identify and prospectively isolate a subset of MSCs (PDGFRalpha+Sca-1+CD45-TER119-) from adult mouse bone marrow. Individual MSCs generated colonies at a high frequency and could differentiate into hematopoietic niche cells, osteoblasts, and adipocytes after in vivo transplantation. Naive MSCs resided in the perivascular region in a quiescent state. This study provides the useful method needed to identify MSCs as defined in vivo entities.


Figures
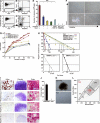
Figure 1.
Figure 1.
Enrichment of mesenchymal stem cells in the PαS population. (A–D) Representative flow cytometric profiles of BM mononuclear cells stained with CD45, TER119, PDGFRα, and Sca-1 without (A and B) or with (C and D) collagenase treatment. (E) Number of CFU-Fs 14 d after plating. Data are mean ± SEM (n = 3 per group; **, P < 0.01; †, no colonies observed). (F) Phase-contrast micrographs of CFU-Fs 14 d after plating, derived from 5,000 PDGFRαSca-1+, PDGFRα+Sca-1+, PDGFRα+Sca1, or 1 × 10⁴ PDGFRα-Sca-1 cells. (G) Growth curves of representative populations derived from 5,000 cells plated. (H) Negative linear relationship between the number of subpopulation BM cells seeded and the proportion of negative colony formation obtained by three independent experiments. (I) Adipogenesis (left) was indicated by neutral lipid vacuoles that stained with oil red O on day 14. Chondrogenesis (middle) indicated by toluidine blue staining on day 21 and by morphological changes. Osteogenesis (right) indicated by alkaline phosphatase staining on day 14. (J) CFU-Cs assays. PαS cells (5,000) and CD34 KSL cells (100) were seeded into separate cultures with MethoCult medium. The total numbers of colonies counted at 14 d are shown. †, no colonies observed. (K) Phase-contrast micrograph of a representative colony derived from CD34 KSL cells (top). No colonies arose from PαS cells under this condition (bottom). Bars, (F, I, and K) 100 µm. (L) Two-dimensional flow cytometric profile of the Hoechst-Red and Hoechst-Blue fluorescence intensity of PI-negative cells (gray) and PαS cells (red). Data are representative of three independent experiments.
Figure 2.
Figure 2.
Identification of MSC potential by clonal assay. (A) Phase-contrast micrographs of a representative colony from a single PαS cell. Bar, 200 µm. (B) Comparison of the differentiation potential of clonally derived cells. Adipogenic (day 14), chondrogenic (day 21), osteogenic (day 14), and endothelial (anti-PECAM-1+ and VE-cadherin+, day 21). Bars, 100 µm. (C) RT-PCR analysis of transcription factors and lineage-specific genes. Expression of adipocyte- (Adipsin, PPARγ, and mLP), chondrocyte- (CollagenII, CollagenX, and Aggrecan), and osteocyte-specific (Osteopontin, Osteocalcin, and PTHr) markers, 3 wk after differentiation induction. Data are representative of five independent experiments.
Figure 3.
Figure 3.
In vivo localization and phenotype of PαS cells. Whole-mount IHC was performed in bone marrow from wild-type C57BL/6 animals. (A) Representative results for quadruple IHC of PDGFRα (green), Sca-1 (red), αSMA (white), and DAPI (blue) in untreated bone marrow. (B) High magnification image of the boxed area in A. PαS cells (arrows), vascular smooth muscle cells (arrowheads). Data are representative of three independent recipients. (C) Quantitative RT-PCR analysis of Ang-1 and CXCL12. The expression levels detected in PDGFRα Sca-1 cells were defined as 1 for each experiment. Mean ± SEM; n = 6 per group. (D) Triple IHC of Sca-1 (red), DAPI (blue), and Ang-1 (green, top left) or CXCL12 (green, bottom left). Data are representative of three independent recipients. (E) Representative results of flow cytometric analysis for cell-surface markers by using freshly isolated BMMNCs from wild-type C57BL/6 animals of three independent experiments. Blue line, isotype control; red line, specific antibodies. Bars: (A, B, and D) 50 µm.
Figure 4.
Figure 4.
Multilineage capacity of transplanted PαS cells in vivo. Representative pictures of bone specimens from lethally irradiated wild-type C57BL/6 mice (EGFP CD45.1; n = 5 mice in three independent experiments), 16 wk after the intravenous transplantation of 104 PαS cells from CAG-EGFP transgenic mice BMMNCs (EGFP+ CD45.1) and of 100 CD34KSL cells from B6-Ly5.1 (EGFP CD45.1+) mice. (A) The boxed areas in the top panels are shown enlarged in the bottom panels. Bars: (top) 100 µm; (bottom) 50 µm. (B) Double IHC of GFP (green; a, d, g, j, and m) and either αSMA (red; b and c), CXCL12 (red; e and f), Ang-1 (red; h and i), osteocalcin (red; k and l), or perilipin (red; n, o). Nuclei were stained with DAPI (blue; c, f, i, l, o). Note the GFP+ cells (arrows) differentiated into perivascular cells expressing CXCL12, osteoblasts, or adipocytes, but not vSMCs (arrowheads). Bars: (c and i) 20 µm; (f, l, o) 50 µm.
Figure 5.
Figure 5.
Self-renewal and differentiation capacity of transplanted PαS cells. Wild-type B6 animals were intravenously transplanted with freshly isolated 104 PαS cells. (A) Representative result from flow cytometric analysis of EGFP expression of BMMNCs in recipient mice (n = 5 mice in three independent experiments) at 16 wk after transplantation. (B) PαS cells from five recipients were then single sorted by flow cytometry and cultured individually in 96-well tissue culture plates. Bar, 50 µm. Colonies were formed by the sorted single PαS, which were able to sustain proliferation in vitro. Bar, 100 µm. (C) GFP+ PαS clones derived from transplanted PαS were multipotent and could give rise to adipocytes (left; oil red O staining, day 14), chondrocytes (middle; toluidine blue staining, day 21), and osteocytes (right; alkaline phosphatase staining, day 14). Bar, 100 µm.
Figure 6.
Figure 6.
In vivo effects of lethal irradiation on the quiescence of PαS cells. HSCs (CD34KSL) from B6-Ly5.1 (CD45.1) mice and PαS cells (MSCs) from CAG-EGFP transgenic mice were transplanted together into lethally irradiated B6-Ly5.2 mice to examine the competitive repopulation of the appropriate niches. The graph shows the percentage of CD45.1 and GFP donor-derived cells detected in the BM of recipient mice 16 wk after transplantation (CD45.1, 81.1 ± 4.95%; GFP+, 7.4 ± 0.40%.; n = 3 per group in three independent experiments). (B) The numbers of HSCs (KSL, c-Kit+Sca-1+Lin) and MSCs (PαS, PDGFRα+Sca-1+) in the BM were calculated by ([Total number of BMMNCs] × [% of the cells] /100). Black bar, untreated control mice; gray bar, irradiated mice, 10 d after lethal irradiation. Results are means ± SEM (n = 3 per group). (C) The number of CFU-Fs formed from PαS cells isolated from either of unirradiated control (black) or lethally irradiated (Gray) wild-type C57BL/6. Means ± SEM (n = 3 per group). (D) Representative flow cytometric analysis of HSCs (KSL, top) or MSCs (PαS, bottom) in BMMNCs of lethally irradiated or unirradiated control mice. (E) Flow cytometry analysis of PY/Hoechst-stained PαS cells of unirradiated (left) and lethally irradiated (right) mice. Data are representative of three independent experiments.

References

    1. Agematsu K., Nakahori Y. 1991. Recipient origin of bone marrow-derived fibroblastic stromal cells during all periods following bone marrow transplantation in humans. Br. J. Haematol. 79:359–365 10.1111/j.1365-2141.1991.tb08041.x - DOI - PubMed
    1. Arai F., Hirao A., Ohmura M., Sato H., Matsuoka S., Takubo K., Ito K., Koh G.Y., Suda T. 2004. Tie2/angiopoietin-1 signaling regulates hematopoietic stem cell quiescence in the bone marrow niche. Cell. 118:149–161 10.1016/j.cell.2004.07.004 - DOI - PubMed
    1. Awaya N., Rupert K., Bryant E., Torok-Storb B. 2002. Failure of adult marrow-derived stem cells to generate marrow stroma after successful hematopoietic stem cell transplantation. Exp. Hematol. 30:937–942 10.1016/S0301-472X(02)00821-4 - DOI - PubMed
    1. Bacon E.R., Sytkowski A.J. 1987. Identification and characterization of a differentiation-specific antigen on normal and malignant murine erythroid cells. Blood. 69:103–108 - PubMed
    1. Barbash I.M., Chouraqui P., Baron J., Feinberg M.S., Etzion S., Tessone A., Miller L., Guetta E., Zipori D., Kedes L.H., et al. 2003. Systemic delivery of bone marrow-derived mesenchymal stem cells to the infarcted myocardium: feasibility, cell migration, and body distribution. Circulation. 108:863–868 10.1161/01.CIR.0000084828.50310.6A - DOI - PubMed

Publication types

MeSH terms