. 2009 Oct 19;187(2):185-99.
doi: 10.1083/jcb.200808016.

Cohesin SMC1beta protects telomeres in meiocytes

Affiliations

Cohesin SMC1beta protects telomeres in meiocytes

Caroline Adelfalk et al. J Cell Biol. .

Abstract

Meiosis-specific mammalian cohesin SMC1beta is required for complete sister chromatid cohesion and proper axes/loop structure of axial elements (AEs) and synaptonemal complexes (SCs). During prophase I, telomeres attach to the nuclear envelope (NE), but in Smc1beta(-/-) meiocytes, one fifth of their telomeres fail to attach. This study reveals that SMC1beta serves a specific role at telomeres, which is independent of its role in determining AE/SC length and loop extension. SMC1beta is necessary to prevent telomere shortening, and SMC3, present in all known cohesin complexes, properly localizes to telomeres only if SMC1beta is present. Very prominently, telomeres in Smc1beta(-/-) spermatocytes and oocytes loose their structural integrity and suffer a range of abnormalities. These include disconnection from SCs and formation of large telomeric protein-DNA extensions, extended telomere bridges between SCs, ring-like chromosomes, intrachromosomal telomeric repeats, and a reduction of SUN1 foci in the NE. We suggest that a telomere structure protected from DNA rearrangements depends on SMC1beta.


Figures
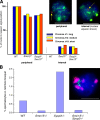
Figure 1.
Figure 1.
Telomere clustering in spermatocytes deficient in SMC1β and SYCP3. (A) Percentage of nuclei showing internal or peripheral position of telo-FISH signals of either chromosome No. 1 (long), 12 (medium), or 19 (short). Spermatocytes from WT, Smc1β−/−, and Smc1β−/− Sycp3−/− strains were analyzed (n = 60). Examples for internal or peripheral positions are shown in the images. Red, chromosome-specific cosmid telo-FISH; green, SYCP3. The arrows point to peripheral and internal telomere signals, respectively. (B) The percentage of spermatocytes that display clustered telomeres (bouquet stage) among spermatocytes I for the mouse strains indicated (n = 4,083 [WT], 4,111 [Smc1β−/−], 4,056 [Sycp3−/−], and 4,019 [Smc1β−/−Sycp3−/−]). The inset shows an example of a bouquet staining. Green, telo-FISH; red, satellite pericentromeric major satellite probe. Bars, 10 µm.
Figure 2.
Figure 2.
SMC1β and SMC3 localization on spermatocyte telomeres. (A) Anti-SMC3 ChIP from GFP+ spermatocytes purified by FACS from SMC1βprom-GFP juvenile mice. ChIP slot-blot analysis of telomeric DNA. Antibodies used for IP and controls (anti–H4 3-meK20 and rabbit [Rab] IgG) are indicated. The amount of input loaded on the blot, shown as a percentage of the total, is indicated on the left. Quantification of the signals, shown as a percentage of input DNA, is shown at the bottom. (B) Anti-SMC1β or anti-SMC3 ChIP from adult WT or Smc1β−/− testis cells followed by slot-blot analysis as in A. No ab, no antibody. (C) Early pachytene spermatocyte spreads were stained with telo-FISH (red), anti-SMC3 (green), and DAPI. (left) An example of telo-FISH signals close to the SMC3-stained axis (boxed areas) are magnified in insets. (right) Quantification of SMC1β or SMC3 and telomere signals along individual chromosome axes. In WT cells, the anti-SMC1β and telo-FISH signals of the indicated chromosome (red lines) partially overlap. The marked WT chromosome stained with anti-SMC3 shows one full and one partial overlap with telomere signals. The indicated Smc1β−/− chromosome shows one telomere signal not overlapping with the SMC3 signal and one partially overlapping. The digram shows the percentage of telomere signal overlap with SMC1β or SMC3 on WT or Smc1β−/− chromosomes. n = 195 (WT SMC1β), 220 (WT SMC3), and 382 telomeres (KO SMC3). **, P < 0.001 by χ2 test. Bars, 10 µM.
Figure 3.
Figure 3.
Electron microscopy of telomere attachment sites in WT and Smc1β−/− mice. (A–C) Electron-dense lateral elements (LE) of SCs (A and B) and unsynapsed AEs (C) of pachytene spermatocytes terminate with a conical thickening at the attachment plate. (C) Arrows indicate attachment sites at the NE. (D) For comparison, a WT SC is shown at the same magnification as in C. (E–E″) Three consecutive sections of a series of 12 sections through a pachytene Smc1β−/− spermatocyte showing a full-length SC. The distal telomere (lacking heterochromatin) is attached at the NE (E, arrow), whereas the proximal telomere is not associated with the NE but is free in the nuclear interior. The SC ends in the centromeric heterochromatin mass (CeH). CE, central element. Bars: (A and B) 0.2 µm; (C and D) 0.5 µm; (E–E″) 1 µm.
Figure 4.
Figure 4.
Telomere length analysis. (A) Assessment of telomere length in WT or Smc1β−/− spermatocytes. Southern blotting and ethidium bromide (EtBr)–stained gel for loading control of Smc1β+/− testis DNA (Het) and Smc1β−/− testis DNA (KO). m, DIG-labeled marker; M, pulsed field gel electrophoresis low-range marker. Bars indicate the length of the telomere signal smear. (B) Quantitative telo-FISH of zygotene or pachytene spermatocyte spreads such as those shown in Figs. 6 and 7 using ImageJ software. (C) Box and whiskers plot to visualize median lengths (−) and maximum range (+). The intervals containing the median 50% of telomere intensity values are boxed (7.8–22.5 fluorescence telomere intensity units [F-TIU]).
Figure 5.
Figure 5.
Structural aberrations at chromosome ends in Smc1β−/− spermatocytes. Analysis of G-strands by telo-FISH (green) and costaining for the SC (red, SYCP3) and DAPI of spermatocyte spreads. (A–D) Graphs show mean numbers of aberrations in WT and Smc1β−/− cells at zygotene and pachytene. (A) Total number of telomeres per cell. (B) Number of SC-less telomeres per cell. (C) Number of telo-less SCs per cell. (D) Numbers of telomere stretches per cell. (E) Number of telomere bridges per cell. Images show examples of the aberrations in Smc1β−/− pachytene cells. P < 0.0001. (F) Smc1β+/− pachytene cell. (G) Smc1β−/− cells. White arrows, SC-less telomeres; gray arrows, telo-less SCs; turquoise arrows, stretches; yellow arrow, unpaired telomeres. Boxed areas show apparent bridges and stretches, which are shown in higher magnification in insets. Error bars indicate SD. Bars, 10 µm (except in insets).
Figure 6.
Figure 6.
Intrachromosomal telomere repeats and proteins associated with telomeric aberrations. (A and B) Ring-like chromosomes with one telomere signal (A) and linear chromosomes with internal telomere signals (B) on the G- (green) and C-strand (red). (C) Telomere-associated proteins TRF1, TRF2, and RAP1 at telomere stretches and bridges. Bars, 10 µm. Yellow arrows point to intrachromosomal telomere signals, and white arrows indicate MPTAs associated with TRF1, TRF2, or RAP1.
Figure 7.
Figure 7.
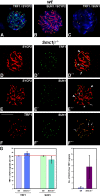
Localization of SUN1 and TRF1 in WT and Smc1β−/− spermatocytes. Images represent projections of confocal z stacks. (A–C) In WT, TRF1 (A, red), and SUN1 (B, green), both localize to the ends of the SCs (A, green; B, red) and colocalize with each other (C). (D–D″) Fluorescent images of a Smc1β−/− spermatocyte simultaneously labeled with SYCP2 (red) and TRF1 (green). The small arrow indicates TRF1 signals not associated with SC structures, and the large arrow denotes a subtelomeric unpaired and stretched AE. The arrowhead indicates an SC end without TRF1 signal. (E–E″) Simultaneous labeling with SYCP2 (red) and SUN1 (green). Ends that appear free of SUN1 are indicated by arrowheads. SC-less SUN1 spots are indicated by arrows. (D″ and E″) Asterisks indicate gaps in SCs. (F–F″) Double labeling for TRF1 (red) and SUN1 (green). Arrows indicate TRF1 signals lacking SUN1 signals. (G) Quantification of TRF1 and SUN1 signals. WT, ∼41 TRF1 (40.88 ± 0.45; n = 42) and SUN1 (40.61 ± 0.59; n = 41) spots; Smc1β−/−, increased TRF1 (43.85 ± 2.12; P < 0.001; n = 53) and decreased SUN1 signals (35.89 ± 4.21; P < 0.001; n = 58). A mean of 7.63 (±3.97; n = 32) SUN1-less TRF1 signals are seen in Smc1β−/− (WT, 0.38 ± 0.50; n = 21). The red line is drawn at 41, the number of telomere signals in cells with fully synapsed chromosomes. Error bars indicate SD. Bar, 10 µm.
Figure 8.
Figure 8.
Telomere aberrations and SUN1 association. (A) Correlation of the mean telomere length as assessed by Q-FISH, i.e., telomere signal intensity with presence or absence of SUN1. In WT, all telomeres are associated with SUN1. (B) Distribution of telomere length and association with SUN1 (SUN1pos and SUN1neg) for Smc1β−/− pachytene spermatocytes; the WT distribution of telomere length is shown for comparison. (C–E) Telo-FISH combined with IF staining for SYCP3 and SUN1 in WT (C) and Smc1β−/− spermatocytes (D and E). (E) Individual aberrant telomere structures from D as indicated (arrows) or from similar images. Error bars indicate SD. Bars, 10 µm.
Figure 9.
Figure 9.
MPTAs in Smc1β−/− oocytes. (A and B) IF images showing a variety of aberrations in pachytene oocytes. (A) Telomere bridges visualized by RAP1 staining (green) between two or three SCs (SYCP3, red). (B) Gaps (arrow) between the telomeric signal (RAP1, green) and the SC (SYCP3, red; left inset), and split telomeres at one end and no telomere signal on the other end of a chromosome (right inset). (C and D) Quantification of telomere length of zygotene oocytes (n = 10 each). (C) Intensity plot of the telomere signal gained by G-strand telo-FISH. (D) Whisker box plot of WT and Smc1β−/− (KO) cells showing the median telomere length (−) and the maximum length range (+). (E) WT oocyte control staining. Insets indicate individual chromosome magnifications of the indicated boxed areas. Bars: (whole nucleus images) 10 µm; (insets) 2 µm.

References

    1. Achi M.V., Ravindranath N., Dym M. 2000. Telomere length in male germ cells is inversely correlated with telomerase activity.Biol. Reprod. 63:591–598 doi:10.1095/biolreprod63.2.591 - DOI - PubMed
    1. Akhmedov A.T., Gross B., Jessberger R. 1999. Mammalian SMC3 C-terminal and coiled-coil protein domains specifically bind palindromic DNA, do not block DNA ends, and prevent DNA bending.J. Biol. Chem. 274:38216–38224 doi:10.1074/jbc.274.53.38216 - DOI - PubMed
    1. Bannister L.A., Schimenti J.C. 2004. Homologous recombinational repair proteins in mouse meiosis.Cytogenet. Genome Res. 107:191–200 doi:10.1159/000080597 - DOI - PubMed
    1. Bastos H., Lassalle B., Chicheportiche A., Riou L., Testart J., Allemand I., Fouchet P. 2005. Flow cytometric characterization of viable meiotic and postmeiotic cells by Hoechst 33342 in mouse spermatogenesis.Cytometry A. 65:40–49 - PubMed
    1. Blackburn E.H. 2005. Telomeres and telomerase: their mechanisms of action and the effects of altering their functions.FEBS Lett. 579:859–862 doi:10.1016/j.febslet.2004.11.036 - DOI - PubMed

Publication types

Substances