. 2009 Nov 3;106(44):18650-5.
doi: 10.1073/pnas.0907688106. Epub 2009 Oct 19.

Experimental determination of the evolvability of a transcription factor

Affiliations

Experimental determination of the evolvability of a transcription factor

Sebastian J Maerkl et al. Proc Natl Acad Sci U S A. .

Abstract

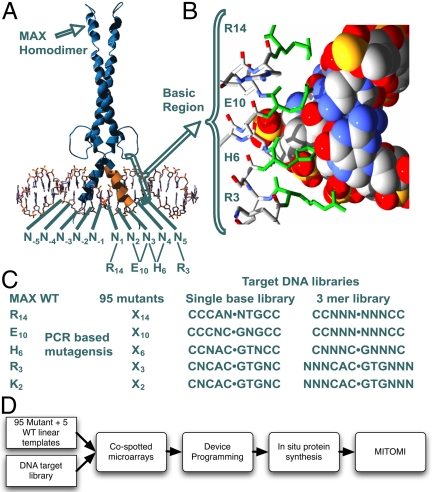
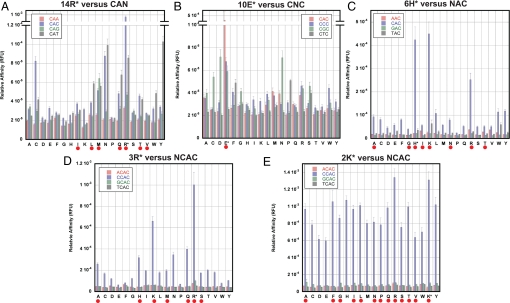
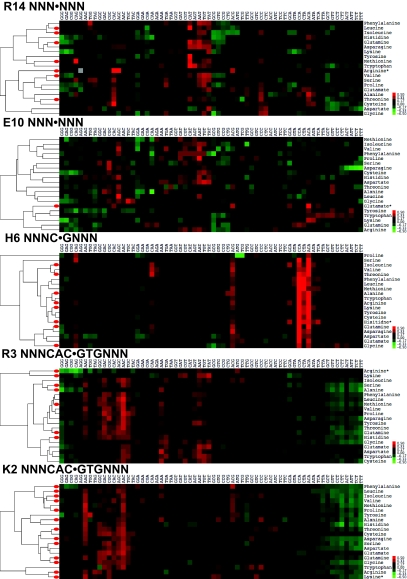
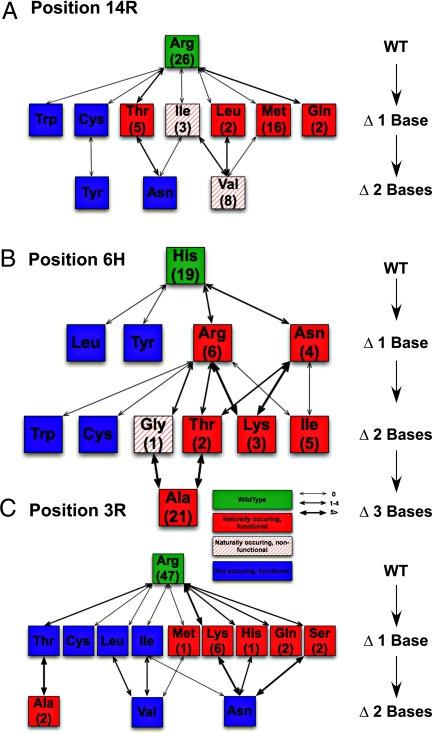
Sequence-specific binding of a transcription factor to DNA is the central event in any transcriptional regulatory network. However, relatively little is known about the evolutionary plasticity of transcription factors. For example, the exact functional consequence of an amino acid substitution on the DNA-binding specificity of most transcription factors is currently not predictable. Furthermore, although the major structural families of transcription factors have been identified, the detailed DNA-binding repertoires within most families have not been characterized. We studied the sequence recognition code and evolvability of the basic helix-loop-helix transcription factor family by creating all possible 95 single-point mutations of five DNA-contacting residues of Max, a human helix-loop-helix transcription factor and measured the detailed DNA-binding repertoire of each mutant. Our results show that the sequence-specific repertoire of Max accessible through single-point mutations is extremely limited, and we are able to predict 92% of the naturally occurring diversity at these positions. All naturally occurring basic regions were also found to be accessible through functional intermediates. Finally, we observed a set of amino acids that are functional in vitro but are not found to be used naturally, indicating that functionality alone is not sufficient for selection.


Conflict of interest statement

The authors declare no conflict of interest.

Figures

Fig. 1.
Fig. 1.
Structure of a Max homodimer bound to DNA (14). (A) The bases are numbered around the symmetry axis (CAC●GTG = N−3N−2N−1●N1N2N3). The respective amino acids and their contacts are shown below the DNA base numbers. (B) Detailed cross-section of the basic region–DNA interface. Four of the five residues permutated in this study are shown in green. (C) The Max mutant library and the corresponding DNA library that was tested for each mutant set. (D) Schematic overview of the experimental setup. Linear mutant templates and DNA targets are synthesized, sequentially cospotted onto an epoxy glass substrate, which in turn is aligned to a microfluidic device. On-chip mutants are synthesized by using in vitro transcription/translation and measured for binding to the cospotted target DNA sequence with MITOMI.
Fig. 2.
Fig. 2.
Dataset of mutants of positions 14 (A), 10 (B), 6 (C), 3 (D), and 2 (E). Each graph shows the 20 amino acids per position and their binding specificity for the indicated DNA sequence. The WT MAX amino acid residue is denoted by an asterisk, and naturally occurring amino acids in other bHLH TFs are indicated by a red dot.
Fig. 3.
Fig. 3.
Large-scale dataset of all 20 amino acid mutants in the five positions measured against a full 3mer (64 DNA sequences). Affinity to a specific sequence is shown by a color gradient from green to red (low to high affinity, respectively). Each row has been normalized to better visualize the DNA-binding preference of each amino acid. The amino acid binding specificities are clustered, and the distances between amino acid specificities are shown on the left side of each graph.
Fig. 4.
Fig. 4.
A graphical representation of the mutational distance of the amino acids, which naturally occur and/or have been determined to be functional in our in vitro assay. The WT amino acid is shown with a green background, with all naturally occurring amino acids shown in red. Functional amino acids are solidly shaded, whereas nonfunctional amino acids are indicated by a hatched shading. Numbers in parentheses below the amino acid abbreviation indicate the number of times the amino acid is observed in the basic region alignment tree (Fig. S2B). The edge thickness corresponds to the observed amino acid substitution rates (41, 42). (A) In position 14, all functional amino acids, with the exception of valine, are one mutational step away from the WT, including the second-most commonly observed amino acid, methionine. Tryptophan and cysteine are both functional and only one mutational step away from the WT, but they are not naturally observed. Tyrosine and asparagine are also not observed and are two mutational steps away. (B) Position 6 shows naturally occurring and functional amino acids up to three mutational moves away from the WT. Particularly interesting is the polar distribution of histidine and alanine, the two most common naturally occurring amino acids. Again, functional amino acids are observed one and two mutational steps away from the WT, which nonetheless are not observed naturally. (C) Position 3 resembles the picture seen in position 14. Here, the two most functional amino acids, arginine and lysine, are also the most common with 47 and six counts, respectively.

References

    1. King MC, Wilson AC. Evolution at 2 levels in humans and chimpanzees. Science. 1975;188:107–116. - PubMed
    1. Gilad Y, Oshlack A, Smyth GK, Speed TP, White KP. Expression profiling in primates reveals a rapid evolution of human transcription factors. Nature. 2006;440:242–245. - PubMed
    1. Isalan M, et al. Evolvability and hierarchy in rewired bacterial gene networks. Nature. 2008;452:840–845. - PMC - PubMed
    1. Mustonen V, Kinney J, Callan CG, Lassig M. Energy-dependent fitness: A quantitative model for the evolution of yeast transcription factor binding sites. Proc Natl Acad Sci USA. 2008;105:12376–12381. - PMC - PubMed
    1. Moses AM, Chiang DY, Kellis M, Lander ES, Eisen MB. Position specific variation in the rate of evolution in transcription factor binding sites. BMC Evol Biol. 2003;3:19. - PMC - PubMed

Publication types

Substances