. 2009 Oct;7(10):e1000220.
doi: 10.1371/journal.pbio.1000220. Epub 2009 Oct 20.

Differentiation driven changes in the dynamic organization of Basal transcription initiation

Affiliations

Differentiation driven changes in the dynamic organization of Basal transcription initiation

Giuseppina Giglia-Mari et al. PLoS Biol. 2009 Oct.

Abstract

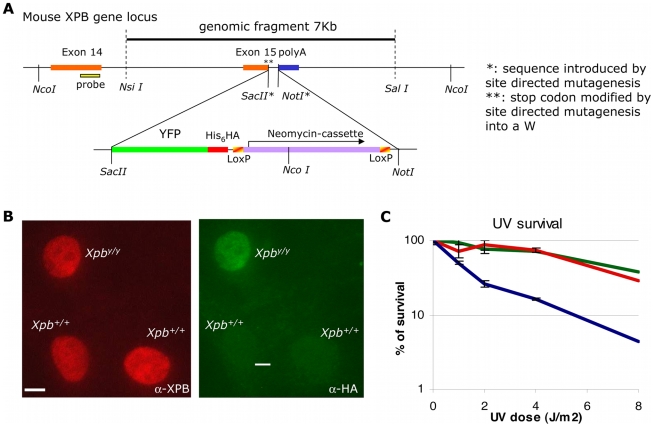
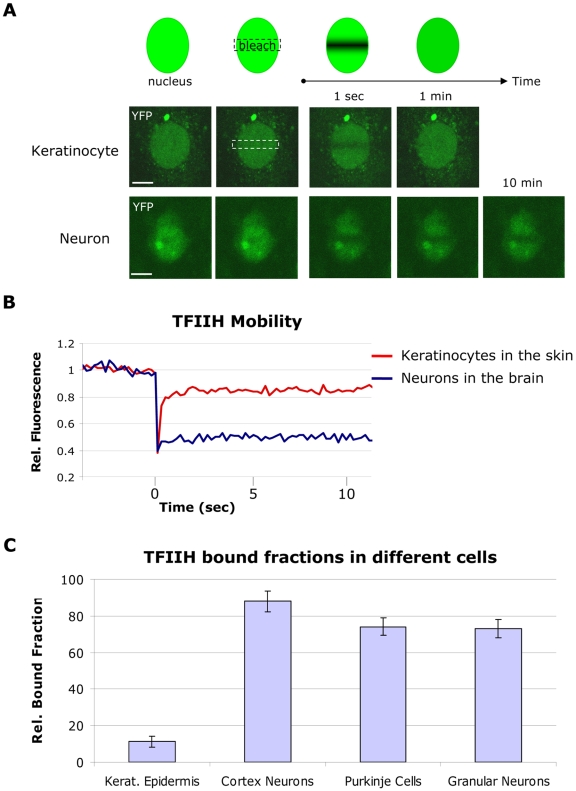
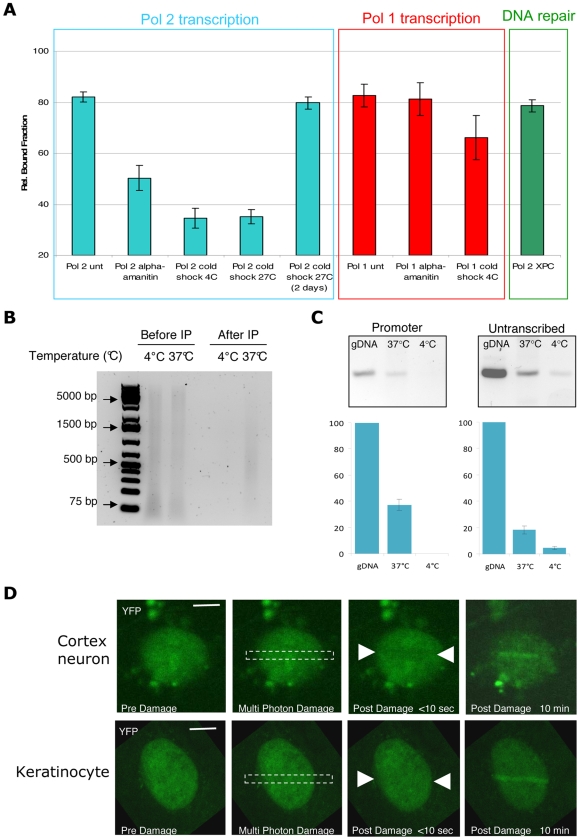
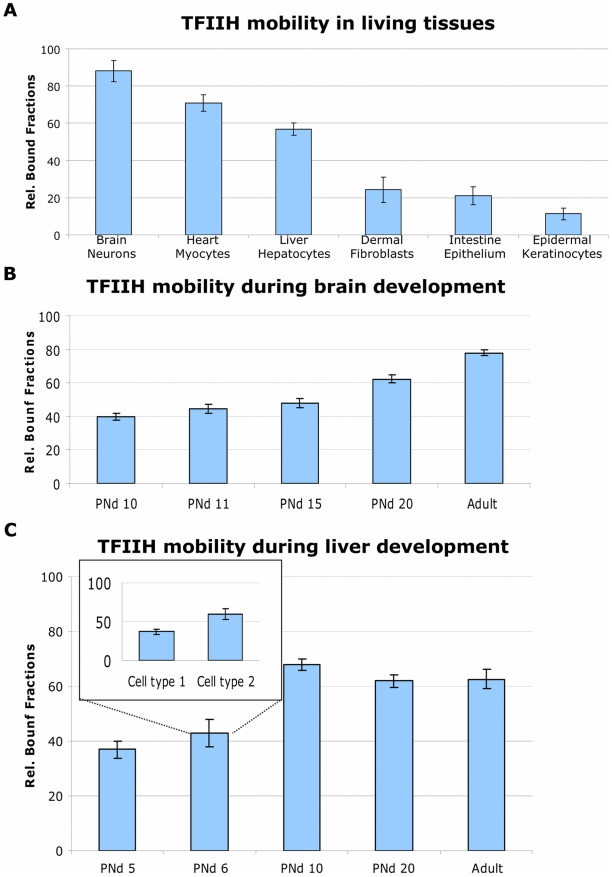
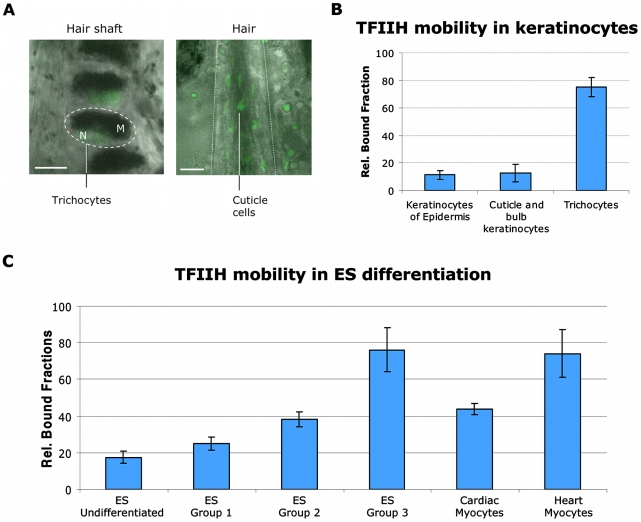
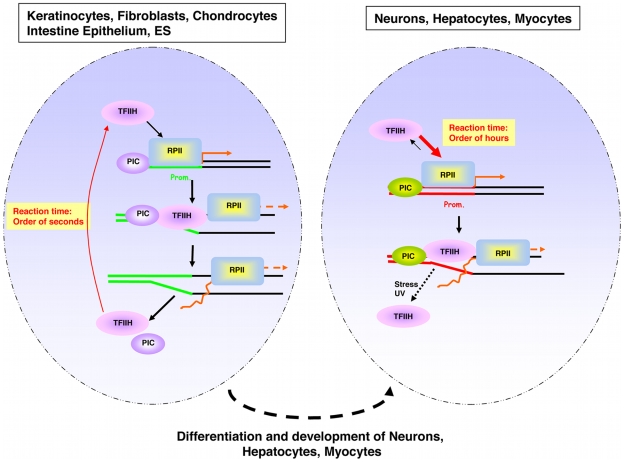
Studies based on cell-free systems and on in vitro-cultured living cells support the concept that many cellular processes, such as transcription initiation, are highly dynamic: individual proteins stochastically bind to their substrates and disassemble after reaction completion. This dynamic nature allows quick adaptation of transcription to changing conditions. However, it is unknown to what extent this dynamic transcription organization holds for postmitotic cells embedded in mammalian tissue. To allow analysis of transcription initiation dynamics directly into living mammalian tissues, we created a knock-in mouse model expressing fluorescently tagged TFIIH. Surprisingly and in contrast to what has been observed in cultured and proliferating cells, postmitotic murine cells embedded in their tissue exhibit a strong and long-lasting transcription-dependent immobilization of TFIIH. This immobilization is both differentiation driven and development dependent. Furthermore, although very statically bound, TFIIH can be remobilized to respond to new transcriptional needs. This divergent spatiotemporal transcriptional organization in different cells of the soma revisits the generally accepted highly dynamic concept of the kinetic framework of transcription and shows how basic processes, such as transcription, can be organized in a fundamentally different fashion in intact organisms as previously deduced from in vitro studies.


Conflict of interest statement

The authors have declared that no competing interests exist.

Figures

Figure 1
Figure 1. Generation and characterization of a mouse model expressing XPB-YFPHis−HA fused protein.
(A) Schematic presentation of the 3′ part of the mouse Xpb gene locus, including the last exons 14 and 15. The dotted line indicates the 7-kb mouse genomic DNA fragment used for gene targeting. The translational stop codon (in exon 15) was mutated to allow in-frame fusion with the modified fluorescent marker, YFP (i.e., ATG-less YFP, with an additional stretch of six histidines and an HA epitope tags). As a dominant selectable marker, a neomycin cassette (flanked by two LoxP sites) was introduced downstream the YFP sequence. Details of the targeting strategy are presented in Materials and Methods. (B) Percentage of surviving cells, 48 h after UV irradiation at the indicated doses of dermal fibroblasts isolated from Xpb+/+ mice (wild-type [wt], green), Xpby/y mice (red), and Xpby/y mice crossed with Xpc (NER-deficient) mice (blue). (C) Comparative immunofluorescence of a mixed population of dermal fibroblasts isolated from an untargeted mouse (Xpb+/+, HA negative) and a targeted mouse (Xpby/y, HA positive), stained with anti-XPB (red, left) or anti-HA (green, right), which recognizes the XPB-YFP-His6HA protein. Bar: 10 µm.
Figure 2
Figure 2. Mobility of TFIIH in cultured cells and in living tissues.
(A) FRAP assay (upper panel) and confocal images of keratinocytes (middle panel) and cortex neurons (lower panel) within tissue sections during FRAP analysis. A small region in the middle of the nucleus is bleached; the subsequent recovery is followed in time for 10 min. Fluorescence is quickly recovered in keratinocytes (less than 10 s; see Figure 2B), whereas in neurons after 10 min, fluorescence in the bleached area is still not fully recovered. Bar: 20 µm. (B) FRAP graph in which the relative fluorescence (Rel. Fluorescence) recovery after bleaching is plotted against time (seconds). The recovery curve of keratinocytes is shown in red and the curve from cortex neurons in blue. (C) TFIIH bound fractions in different cells, calculated as described in Materials and Methods. Amount of immobilized TFIIH is indicated as percentage of the total amount of TFIIH. Error bars represent the standard error of the mean. Rel.: relative.
Figure 3
Figure 3. Mobility of TFIIH in cortex neurons during transcription and repair.
(A) TFIIH bound fractions in cortex neurons from Xpby/y mice treated with α-amanitin (transcription inhibition) or submitted to a cold-shock treatment (4°C or 27°C) for 1 h and 2 d (27°C); the effect on TFIIH mobility was compared to the untreated samples (unt). To measure TFIIH dynamics during Pol 2 transcription, measurements were conducted in the nucleoplasm (blue square); to measure TFIIH dynamics during Pol 1 transcription, measurements were conducted in the nucleoli (red square). TFIIH bound fractions were measured in cortex neurons from Xpby/y•Xpc−/− (NER-deficient) mice (green square). Error bars represent the standard error of the mean. Rel.: relative. (B) Equal amounts of sonicated chromatin solution were analyzed on SYBR Green–stained agarose gel after proteinase K treatment and reversal of the cross-links (lane 1 and 2). Following sonication, HA-antibody was added to the chromatin solution for immunoprecipitation of TFIIH complex. Equal volume of immunoprecipitated DNA fraction complex was loaded on gel (lane 3 and 4). (C) Semiquantitative PCR on 200 ng of genomic DNA (gDNA) and 200 ng of HA-precipitated chromatin from cortex slice incubated at 37°C and 4°C. Promoter sequence from the XPB gene (−143/−274) and untranscribed region adjacent to the XPB gene (chr 18: 32479000–32478600) were amplified. PCR products were quantified and plotted on a bar graph: the y-axis represents the percentage of amplified sequences from the HA-precipitated chromatin versus amplified sequences from gDNA. Asterisk (*): undetectable. Error bars have been calculated for three biological replicates. (D) TFIIH accumulation after multiphoton laser induction of DNA damage in cortex neurons (upper panel) versus cultured keratinocytes (lower panel). Images are taken before and after the damage at different indicated time points. Bar: 10 µm.
Figure 4
Figure 4. Mobility of TFIIH in different cell types and during development.
(A) TFIIH bound fractions are determined in different (indicated) cell types in their tissue. Rel.: relative. (B) TFIIH bound fractions determined at different stages of brain development. PNd, postnatal day. (C) TFIIH bound fractions during different stages of liver development. The insert shows two distinct groups of cells having two different levels of TFIIH immobilization. The error bars represent the standard error of the mean.
Figure 5
Figure 5. Mobility of TFIIH during in vivo and in vitro differentiation.
(A) Left panel: image (bar: 10 µm) of the hair shaft with trichocytes; the dotted circle indicate the body of a trichocyte. Right panel: image of a hair bulb; the dotted line indicates the limit of the hair (bar: 50 µm). Within the hair shaft, cuticle cells are recognizable. M, cytoplasmic melanin inclusions; N, nucleus. (B) TFIIH bound fractions determined in proliferative and differentiated keratinocytes in the tissue. Rel.: relative. (C) TFIIH bound fractions within different populations of in vitro differentiated ES cells and mature heart myocytes within the heart muscle. The error bars represent the standard error of the mean.
Figure 6
Figure 6. Schematic model of TFIIH switch in mobility during differentiation.
Schematic illustration of the nucleus of a proliferative (left) and a postmitotic (right) cell. Green lines (left) and red lines (right) identify the promoter regions. Orange arrows depict the transcriptional start. PIC represents the preinitiation complex. RPBII represents the RNA polymerase II. The arrow width indicates the preferential direction of the equilibrium.

References

    1. Giglia-Mari G, Coin F, Ranish J. A, Hoogstraten D, Theil A, et al. A new, tenth subunit of TFIIH is responsible for the DNA repair syndrome trichothiodystrophy group A. Nat Genet. 2004;36:714–719. - PubMed
    1. Egly J. M. The 14th Datta Lecture. TFIIH: from transcription to clinic. FEBS Lett. 2001;498:124–128. - PubMed
    1. Mitchell J. R, Hoeijmakers J. H, Niedernhofer L. J. Divide and conquer: nucleotide excision repair battles cancer and ageing. Curr Opin Cell Biol. 2003;15:232–240. - PubMed
    1. Dvir A, Conaway R. C, Conaway J. W. A role for TFIIH in controlling the activity of early RNA polymerase II elongation complexes. Proc Natl Acad Sci U S A. 1997;94:9006–9010. - PMC - PubMed
    1. Hoeijmakers J. H, Egly J. M, Vermeulen W. TFIIH: a key component in multiple DNA transactions. Curr Opin Genet Dev. 1996;6:26–33. - PubMed

Publication types

MeSH terms

Substances