. 2009 Nov 24;48(46):11108-16.
doi: 10.1021/bi901180v.

Glutathione transferases are structural and functional outliers in the thioredoxin fold

Affiliations
Free PMC article

Glutathione transferases are structural and functional outliers in the thioredoxin fold

Holly J Atkinson et al. Biochemistry. .
Free PMC article

Abstract

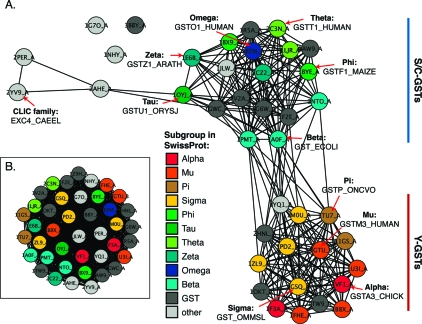
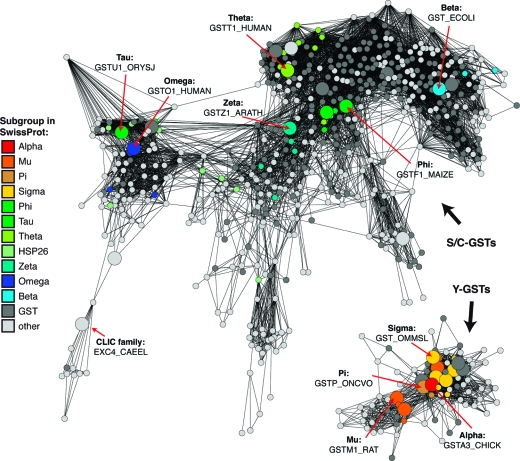
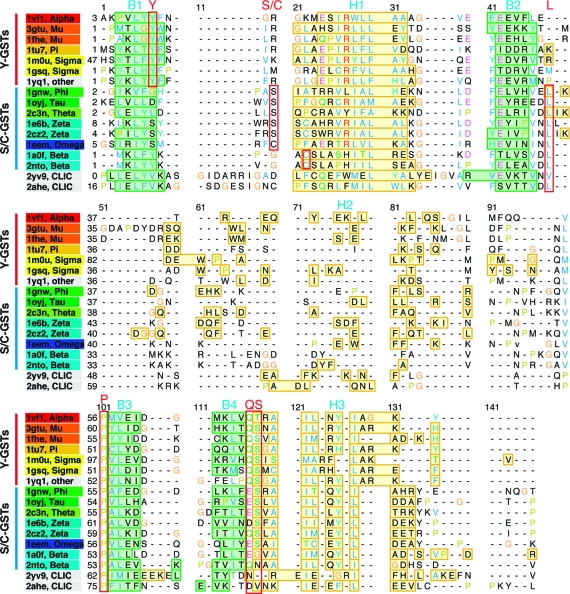
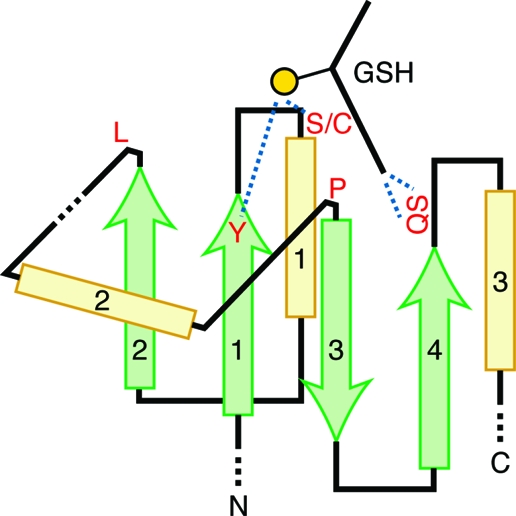
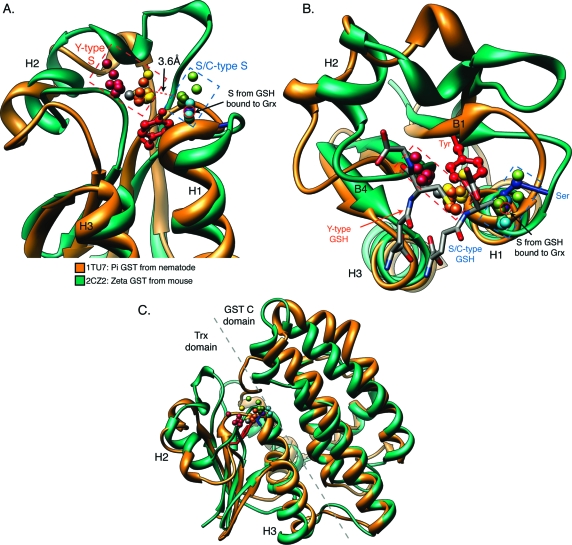
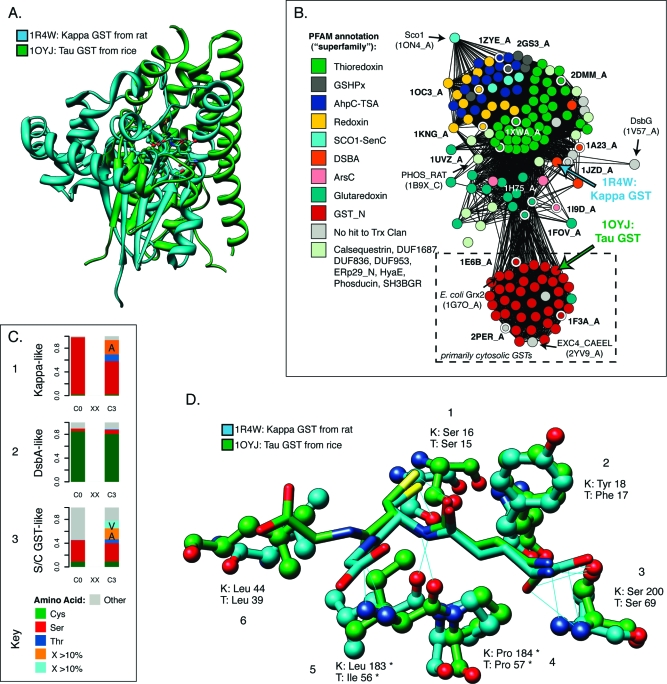
Glutathione transferases (GSTs) are ubiquitous scavengers of toxic compounds that fall, structurally and functionally, within the thioredoxin fold suprafamily. The fundamental catalytic capability of GSTs is catalysis of the nucleophilic addition or substitution of glutathione at electrophilic centers in a wide range of small electrophilic compounds. While specific GSTs have been studied in detail, little else is known about the structural and functional relationships between different groupings of GSTs. Through a global analysis of sequence and structural similarity, it was determined that variation in the binding of glutathione between the two major subgroups of cytosolic (soluble) GSTs results in a different mode of glutathione activation. Additionally, the convergent features of glutathione binding between cytosolic GSTs and mitochondrial GST kappa are described. The identification of these structural and functional themes helps to illuminate some of the fundamental contributions of the thioredoxin fold to catalysis in the GSTs and clarify how the thioredoxin fold can be modified to enable new functions.


Figures

Figure 1
Figure 1
Cytosolic GSTs fall into two major subgroups based on structural similarity. (A) Structure similarity network, containing 40 structures that are a maximum of 60% identical (by sequence) that span the cytosolic GSTs and some other proteins with similar structures (including Escherichia coli Grx 2, PDB entry 1G7O). Similarity is defined by FAST scores (25) better than a score of 16.0; edges at this threshold represent alignments with a median rmsd of 2.5 Å across 177 aligned positions, while the rest of the edges represent better alignments. Each node is colored by the class of the associated sequence in the SwissProt database (as designated in the key, Swissprot uses the term subgroup to designate GSTs normally designated in the literature as classes). Some sequences are only classified to the GST superfamily (“GST”), and others have no classification or one outside of the GST superfamily (“other”). Each structure is labeled with its PDB entry and chain, and examples from each class are labeled with the entry for the associated sequence in SwissProt. (B) Structure similarity network containing the same structures as in panel A, shown at the less stringent threshold of 7.5. Edges at this threshold represent alignments with a median rmsd of 4.5 Å across 153 aligned positions. Nodes are colored as in panel A.
Figure 2
Figure 2
Tyrosine-type GSTs are less populated and less diverse than the other major subgroup of GSTs. Sequence similarity network, containing 622 sequences that are a maximum of 40% identical and span the cytosolic GSTs. Similarity is defined by pairwise BLAST alignments better than an E value of 1 × 10⁻¹²; edges at this threshold represent alignments with a median 27% identity over 200 residues, while the rest of the edges represent better alignments. Each node is colored by the classification of the sequence in SwissProt, if available. Large nodes represent sequences that are associated with the 40 structures in Figure 1.
Figure 3
Figure 3
Structure-based sequence alignment highlights differences between tyrosine-type and serine/cysteine-type cytosolic GSTs. This alignment of the thioredoxin-like domain from representatives spanning the cytosolic GSTs lists both the PDB entry and GST class label for each structure. Amino acid positions of interest are denoted by red boxes and labels that correspond to the locations marked on the diagram of the thioredoxin fold in Figure 4. Residues in α-helices have a yellow background, and those in β-strands have a green background. This alignment was prepared and displayed using UCSF Chimera (27).
Figure 4
Figure 4
Diagram illustrating the secondary structure elements of the thioredoxin-like domain (Trx) found in GSTs. α-Helices are shown as yellow blocks, while β-strands are shown as green arrows. Each element is numbered for reference in the text. The Trx domain is extended in GSTs at the C-terminal end, which continues to complete the overall GST structure. The sulfhydryl group of glutathione (GSH) is displayed as a yellow ball, and key interactions between GSH and residues from the Trx domain are shown as dashed blue lines. Amino acid positions of interest are shown in red type and correspond to the red boxes in the alignment in Figure 3.
Figure 5
Figure 5
Two major subgroups of cytosolic GSTs bind glutathione differently. Structural alignments of representatives from each cytosolic GST class (e.g., alpha and omega) illustrate a difference in the location of the sulfhydryl sulfur of glutathione that is associated with the location of the catalytic residue relative to the fold. (A) A tyrosine-type GST, 1TU7, is shown aligned with a serine-type GST, 2CZ2. Only the Trx-like domains are displayed. Also shown as spheres are the locations of the sulfur from GSH in several examples (if available) from each GST class; the rest of GSH and enzyme ribbon diagrams are not shown. GSH sulfurs are colored according to the class of the parent enzyme based on the keys provided in Figures 1 and 2. The displayed alignment between the Trx-like domain of pi 1TU7 and zeta 2CZ2 has an rmsd of 1.29 Å across 96 atom pairs. The shortest distance between pairs of sulfurs from GSTs of the opposite major subgroup is 3.6 Å as marked on the figure. Also noted is the location of the sulfur of GSH bound to E. coli Grx 3 (3GRX). Sulfurs from a total of 33 liganded structures are shown (see Experimental Procedures). (B) Alternate view of the same alignment showing the location of the sulfurs relative to the amino terminus of H1. Here, the tyrosine from 1TU7 is colored red, and the serine from 2CZ2 is colored purple, as well as the full bound GSH from each displayed enzyme. Dashed boxes mark the locations of the GSH sulfurs in the two major subgroups of enzymes. (C) Full structural alignment between the two example GST monomers, with a dashed line marking the separation between the thioredoxin-like domain and the carboxyl-terminal GST domain.
Figure 6
Figure 6
GST kappa glutathione binding site as an example of convergent evolution. (A) Superposition of the structures of mitochondrial GST kappa (1R4W) and S/C-GST tau (1OYJ) shows that they are very different. While both contain a form of the thioredoxin domain, in kappa, it is interrupted with a large insert before helix 2 (see Figure 4). The alignment superimposes 61 pairs of residues with a 2.17 Å rmsd, all within the Trx domain; six of these amino acids are identical, for a level of sequence identity of ∼10%. The Trx domain in 1OYJ includes ∼80 residues. (B) Within the thioredoxin fold class, GST kappa is structurally distant from the cytosolic GSTs. The structure similarity network shows 159 examples that span the thioredoxin fold. Structures are colored according to their PFAM annotation (see Experimental Procedures), which roughly corresponds to different superfamilies. The locations of 1R4W and 1OYJ are noted. The cytosolic GSTs in Figure 1B are excerpted from this network (dashed box), which is thresholded at a FAST score of 4.5. Edges at this threshold represent alignments with a median rmsd of 2.75 Å across 72 aligned positions. Selected structures (nodes with white borders) in the network are labeled with their PDB entries. (C) The kappa class active site residues are more like cytosolic GSTs than its nearest DsbA-like neighbor class. Bar charts 1−3 show the distributions of amino acids aligning with the catalytic Ser/Cys position in the cytosolic GSTs (C0) and the residue three positions later (C3), commonly termed the CxxC motif. The charts summarize 62, 87, and 538 diverse protein sequences, respectively, from each grouping. (D) Corresponding residues from kappa structure 1R4W and tau cytosolic GST 1OYJ that form binding interactions with glutathione. Predicted H-bonds are shown as thin blue lines. Interactions involving enzyme residues or substructures that are present in all or nearly all variants of the thioredoxin fold are marked with asterisks. Residue pairs are numbered consecutively and discussed in the text.

References

    1. Mannervik B.; Board P. G.; Hayes J. D.; Listowsky I.; Pearson W. R. (2005) Nomenclature for mammalian soluble glutathione transferases. Methods Enzymol. 401, 1–8. - PubMed
    1. Hayes J. D.; Flanagan J. U.; Jowsey I. R. (2005) Glutathione transferases. Annu. Rev. Pharmacol. Toxicol. 45, 51–88. - PubMed
    1. Allocati N.; Federici L.; Masulli M.; Di Ilio C. (2009) Glutathione transferases in bacteria. FEBS J. 276, 58–75. - PubMed
    1. Nebert D. W.; Vasiliou V. (2004) Analysis of the glutathione S-transferase (GST) gene family. Hum. Genomics 1, 460–464. - PMC - PubMed
    1. Armstrong R. N. (1991) Glutathione S-transferases: Reaction mechanism, structure, and function. Chem. Res. Toxicol. 4, 131–140. - PubMed

Publication types

MeSH terms