. 2009 Oct 21;97(8):2202-11.
doi: 10.1016/j.bpj.2009.08.003.

Two-path impedance spectroscopy for measuring paracellular and transcellular epithelial resistance

Affiliations

Two-path impedance spectroscopy for measuring paracellular and transcellular epithelial resistance

Susanne M Krug et al. Biophys J. .

Abstract

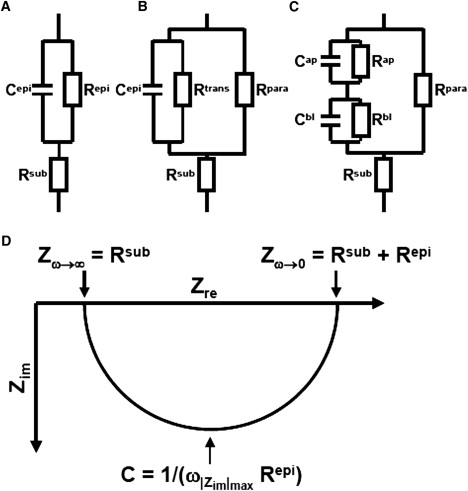
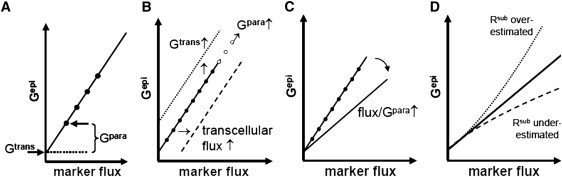
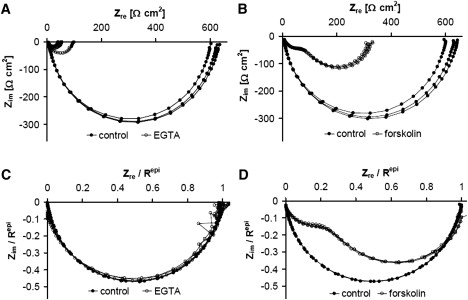
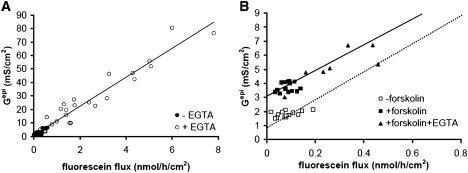
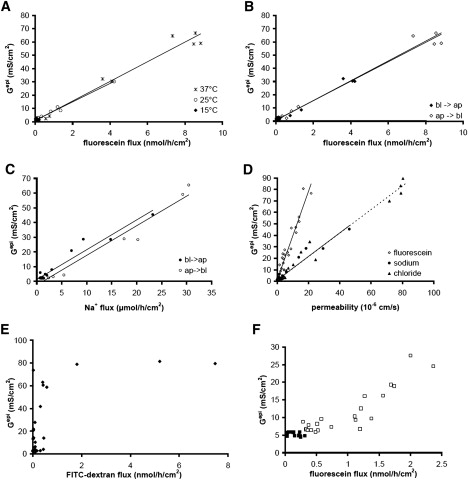
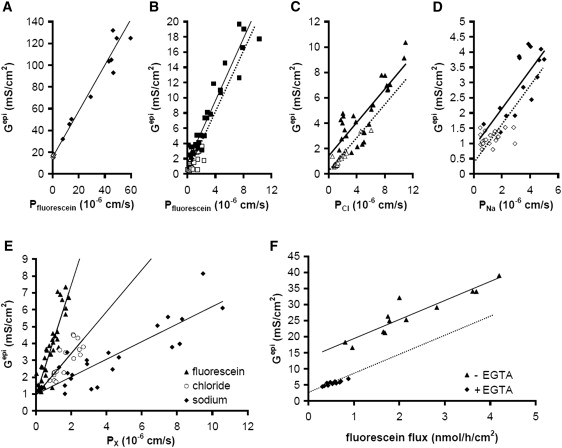
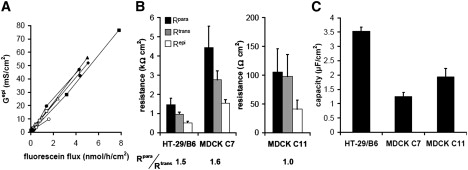
Solutes are transported across epithelial cell layers via transcellular and paracellular pathways. The transcellular pathway leads across the apical and basolateral cell membrane, whereas the paracellular pathway is directed through the tight junction. Tight junction proteins (claudins, occludin, tricellulin) can not only form barriers but also paracellular channels that are--in concert with membrane channels and transporters--regulated in a wide range in health and disease states. Thus, it is desirable to determine para- and transcellular resistance (R(para), R(trans)) separately. This cannot be achieved by conventional transepithelial resistance (TER) measurements. We present an impedance spectroscopic approach that is optimized for differentiation between these two pathways. The method is based on a transepithelial impedance measurement in specialized Ussing chambers, combined with a Ca(2+)-dependent modulation of R(para) through EGTA and flux measurements of a nonradioactive paracellular marker, fluorescein. The prerequisites are a paracellular marker that varies in parallel to 1/R(para), an experimental regime that alters R(para) without affecting R(trans), and exact knowledge of the resistance of subepithelial components. The underlying prerequisites and the applicability as a routine method were verified on cell lines of different tightness including HT-29/B6 colon cells and Madin-Darby canine kidney tubule cells C7 and C11.


Figures

Figure 1
Figure 1
(A) Equivalent electrical circuit for one path impedance measurements, that only discriminate between subepithelial (Rsub) and epithelial (Repi) resistance, and the epithelial capacity Cepi. (B) Equivalent electrical circuit for two path impedance measurements used in this study. Here, the epithelial resistance Repi is composed of a paracellular (Rpara) and a parallel transcellular (Rtrans) resistance. Under DC conditions or AC conditions at very low frequencies Repi = Rpara × Rtrans/(Rpara + Rtrans). (C) Equivalent electrical circuit for a model discriminating between the apical (index ap) and the basolateral (index bl) side of an epithelium. In this model, the capacitance Cepi of the models presented in A and B is composed of Cap and Cbl (Cepi = Cap × Cbl/(Cap + Cbl). Under DC conditions or AC conditions at very low frequencies Repi = Rpara × (Rap + Rbl)/(Rpara + Rap + Rbl). (D) Nyquist diagram (plot of the real and the imaginary portion of the impedance, Zre, Zim) for models shown in A and B. For impedance values measured at different AC frequencies, both models result in a semicircle. For high frequencies (ω → ∞) Zre approaches Rsub, for low frequencies (ω → 0) Zre approaches Rt = Rsub + Repi. The capacitance Cepi can be calculated from the frequency at which |Zim| reaches a maximum (Cepi = 1/(ω|Zim|max × Repi). Nyquist diagrams for the model depicted in C only yield a semicircle, if Cap/Cbl = Rbl/Rap (i.e., if the membrane time constant τ = R × C is constant).
Figure 2
Figure 2
(A) Plotting Gepi versus the flux of a paracellular marker under experimental conditions that only modify the paracellular pathway yields a straight line with the slope s and the y-intercept Gtrans. Gpara is calculated as s × Flux. (B) Varying Gtrans shifts the straight line along the y axis, whereas changing Gpara moves the values along the straight line (open circles). A transcellular flux component of the marker shifts the straight line along the x axis. (C) Changes in the general permeability properties of the paracellular pathway affect the slope of the straight line. (D) Over- or underestimation of Rsub distorts the relationship between flux and Gepi.
Figure 3
Figure 3
Nyquist plot of impedance spectra recorded from a HT-29/B6 cell layer in the absence and presence of EGTA (A and C) and forskolin (B and D). (A) Parameters (mean ± SE) obtained from the three control spectra are Rsub, 5.80 ± 0.13 Ω × cm2; Repi, 615.5 ± 9.4 Ω × cm2; Cepi, 4.63 ± 0.03 μF/cm2. Simultaneously measured fluorescein flux increased from 0.10 ± 0.01 nmol/cm2/h (n = 3) under control conditions by a factor of 20 at an Repi−EGTA of 56 Ω × cm2. This allowed to calculate Rtrans to 1300 Ω × cm2, Rcontrolpara to 1170 Ω × cm2 and REGTApara to 58.5 Ω × cm2 (Eqs. 1 and 2). (B) Parameters (mean ± SE) obtained from the three control spectra: Rsub, 6.90 ± 0.11 Ω × cm2; Repi, 618.5 ± 12.8 Ω × cm2; Cepi, 3.93 ± 0.04 μF/cm2. The simultaneously measured fluorescein flux remained virtually unchanged (control, 0.31 ± 0.05 nmol/cm2/h; forskolin 0.26 ± 0.03 nmol/cm2/h). Without further information, Rtrans and Rpara cannot be determined from these data. (C and D) Same as A and B, but normalized with respect to Repi to illustrate, that changes in the paracellular pathway (EGTA application, C) did not alter the general shape of the curves. In contrast, changing the transcellular pathway by forskolin-induced Cl secretion, greatly alters the general shape of the curves (D).
Figure 4
Figure 4
Gepi versus fluorescein flux plots from experiments on HT-29/B6 cell layers in the absence and presence of EGTA (A) and forskolin followed by EGTA (B). (A) Values obtained in the absence (•) and presence (○) of EGTA fall onto a straight line. Gtrans estimated from the y-intercept: 0.89 mS/cm2 (Rtrans = 1120 Ω × cm2). Line, linear regression; slope 10.7 × 10⁶ S × h/mol. (B) Values obtained after the application of forskolin (■) are shifted along the y axis compared to values obtained under control conditions (□), whereas values in the presence of forskolin and forskolin + EGTA (▴) fall onto a straight line (solid line: linear regression, slope 9.1 × 10⁶ S × h/mol). This line has a similar slope as the line obtained in the absence of forskolin obtained in A (dotted line). Thus, in the presence of forskolin, Gtrans increased to 3.0 mS/cm2 (Rtrans = 333 Ω × cm2).
Figure 5
Figure 5
(A) Gepi versus fluorescein flux was independent of temperature in the range of 15°C to 37°C. Line, linear regression; slopes 7.4 × 10⁶ S × h/mol (37°C), 7.0 × 106 S × h/mol (25°C). (B) Gepi versus fluorescein flux was independent of the flux direction (basolateral to apical, ♦; apical to basolateral, ♢, slopes of regression lines 7.5 × 10⁶ S × h/mol and 7.4 × 10⁶ S × h/mol, respectively). (C) In contrast, Gepi versus Na+ flux was clearly dependent of the flux direction (basolateral to apical, •; apical to basolateral, ○). Slopes of regression lines were similar (2.03 × 10³ S × h/mol and 2.01 × 10³ S × h/mol, respectively) but values in the apical to basolateral direction were shifted along the x axis, indicating a transcellular Na+ flux under these conditions. Gtrans calculated from data in the basolateral to apical direction was similar to Gtrans calculated from fluorescein flux (Fig. 4A) and amounted to 1.05 mS/cm2 (Rtrans = 950 Ω × cm2), whereas in the apical to basolateral direction a calculation of Gtrans would yield a value of −2.42 mS/cm2 (Rtrans = −410 Ω × cm2). (D) Comparison of Gtrans versus flux of fluorescein (♢), Na+ (basolateral to apical, ♦) and Cl (apical to basolateral, ▴). The y-intercepts under these three conditions result in a mean Gtrans of 0.88 mS/cm2 (Rtrans = 1140 Ω × cm2). The slopes for Na+ (1.029 × 10³ S × s/cm3) and Cl flux (1.031 × 10³ S × s/cm3) were very similar, indicating, that HT-29/B6 cell layers do not discriminate between these two ions. The slope for fluorescein was larger (3.9 × 10³ S × s/cm3), i.e., fluorescein permeability lower, as expected for an ion of larger diameter. (E) In contrast to fluorescein, Gepi versus 10 kDa FITC-dextran flux did not result in a straight line, indicating that 10 kDa FITC-dextran does not pass through the same paracellular pores as the ions determining paracellular conductance. (F) In Caco-2 cell layers Gepi versus fluorescein flux (apical to basolateral) did not yield a straight line (values the absence ■ and presence □ of EGTA). Therefore, fluorescein flux should not be used to estimate Gtrans in these cells.
Figure 6
Figure 6
(A) Gepi versus fluorescein permeability plots from experiments on MDCK C11 cell layers. Values obtained in the absence (♢) and presence (♦) of EGTA fall onto a straight line. Gtrans estimated from the y-intercept: 15.4 mS/cm2 (Rtrans = 64.9 Ω × cm2). Line: linear regression, slope 2.12 × 10³ S × s/cm3. (B) Gepi versus fluorescein permeability plots from experiments on MDCK C7 cell layers. Values obtained in the absence of EGTA (□) do not fall onto the same line as those obtained in the presence of EGTA (■). Estimates from the y-intercept of the linear regression (solid line, slope 2.05 × 10³ S × s/cm3) of the values obtained in the presence of EGTA yielded a Gtrans of 1.44 mS/cm2, but values in the absence of EGTA lie ∼1 mS/cm2 lower, as judged by shifting the regression line along the y axis (dotted line). (C) Gepi versus Cl permeability plots from experiments on MDCK C7 cell layers. As in B, values obtained in the absence of EGTA (▵) lie ∼1 mS/cm2 lower than estimated from a linear regression (solid line, slope 0.66 × 10³ S × s/cm3) of values obtained in the presence of EGTA (▴). In the presence of EGTA a Gtrans of 1.41 mS/cm2 is calculated. (D) Gepi versus Na+ permeability plots from experiments on MDCK C7 cell layers. As in B and C, values obtained in the absence of EGTA (♢) lie ∼1 mS/cm2 lower than estimated from a linear regression (solid line, slope 0.63 × 10³ S × s/cm3) of values obtained in the presence of EGTA (♦). In the presence of EGTA a Gtrans of 1.1 mS/cm2 is calculated. Thus, from B-D, the mean Gtrans in the absence of EGTA amounts to 0.31 mS/cm2, yielding a Rtrans of 3230 Ω × cm2. (E) In MDCK C7 cells stably transfected with the paracellular cation pore claudin-10b, a plot of Gepi versus fluorescein (▴), Cl (○), and Na+ (♦) permeability yields Gtrans values of 0.94, 0.93, and 0.98 mS/cm2, respectively, which have to be corrected by 0.6 mS/cm2 for values in the absence of EGTA. Rtrans thus amounts to 2860 Ω × cm2. The slope of Gepi versus Na+ (0.50 × 103 S × s/cm3) is lower than for Cl (1.12 × 10³ S × s/cm3) and fluorescein (3.3 × 10³ S × s/cm3), mirroring the claudin-10b-induced increased in cation. (F) An atypical clone of MDCK II cells stably transfected with claudin-3 clone presented a strongly reduced Gtrans in the absence of EGTA (♦) whereas in the presence of EGTA (▴), Gtrans (13.4 mS/cm2) was comparable to the Gtrans obtained in control cells shown in A. Solid line: linear regression (slope 5.9 × 10⁶ S × h/mol); dotted line: regression line shifted along the y axis.
Figure 7
Figure 7
(A) Gepi versus fluorescein permeability plot from experiments on HT-29/B6 cell layers in the absence and presence of EGTA. Gtrans and Gpara from different experiments (points joined by lines for clarity; see Fig. S3 for regression lines) can be evaluated separately to obtain mean resistances, if the general plot of all values shows no effects of EGTA on Gtrans. If, as in MDCK C7 cells, EGTA has an effect on Gtrans, values have to be corrected (Fig. 6). (B) Mean ± SE of Rpara, Rtrans, and Repi calculated from single experiments (HT-29/B6, n = 8; MDCK C7, n = 6; MDCK C11, n = 5) as described in A. A ratio Rpara/Rtrans >1 indicates a (moderately) tight epithelium (HT-29/B6, MDCK C7), a ratio ≤1 a leaky epithelium (MDCK C11). (C) Mean ± SE of the epithelial capacities in HT-29/B6 and MDCK cell layers. Capacity values per unit filter area are significantly higher in HT-29/B6 than in both MDCK C7 and C11 cells (p < 0.01, Student's t-test), indicating a stronger increase in surface area in these cells, e.g., through microvilli or membrane invaginations. Rsub was similar for all cell types (HT-29/B6, 10.9 ± 1.4 Ω × cm2; MDCK C7, 11.4 ± 1.2 Ω × cm2; MDCK C11, 10.7 ± 1.6 Ω × cm2) and is assumed to primarily reflect the resistance of the filter supports.

References

    1. Tsukita S., Furuse M., Itoh M. Multifunctional strands in tight junctions. Nat. Rev. Mol. Cell Biol. 2001;2:285–293. - PubMed
    1. Ikenouchi J., Furuse M., Furuse K., Sasaki H., Tsukita S. Tricellulin constitutes a novel barrier at tricellular contacts of epithelial cells. J. Cell Biol. 2005;171:939–945. - PMC - PubMed
    1. Amasheh S., Meiri N., Gitter A.H., Schöneberg T., Mankertz J. Claudin-2 expression induces cation-selective channels in tight junctions of epithelial cells. J. Cell Sci. 2002;115:4969–4976. - PubMed
    1. Günzel D., Stuiver M., Kausalya P.J., Haisch L., Krug S.M. Claudin-10 exists in six alternatively spliced isoforms which exhibit distinct localization and function. J. Cell Sci. 2009;122:1507–1517. - PubMed
    1. Mankertz J., Schulzke J.D. Altered permeability in inflammatory bowel disease: pathophysiology and clinical implications. Curr. Opin. Gastroenterol. 2007;23:379–383. - PubMed

Publication types

MeSH terms