. 2009 Oct 21;97(8):2222-31.
doi: 10.1016/j.bpj.2009.07.056.

Spatial and temporal dynamics of mitochondrial membrane permeability waves during apoptosis

Affiliations

Spatial and temporal dynamics of mitochondrial membrane permeability waves during apoptosis

Patrick D Bhola et al. Biophys J. .

Abstract

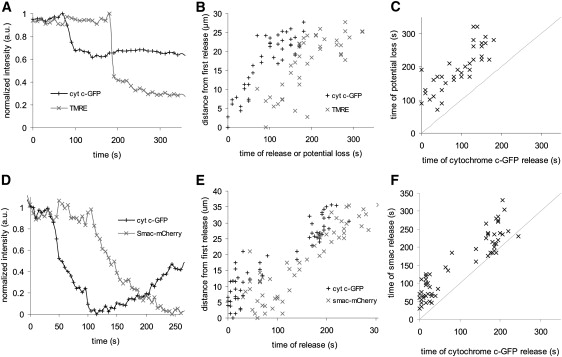
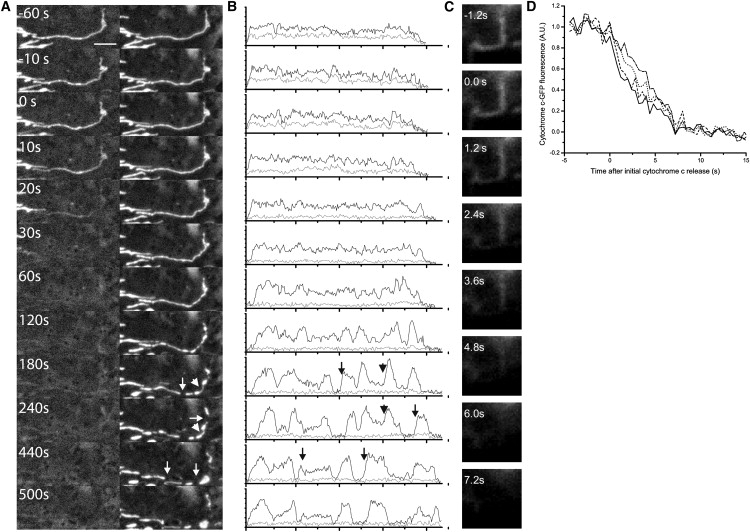
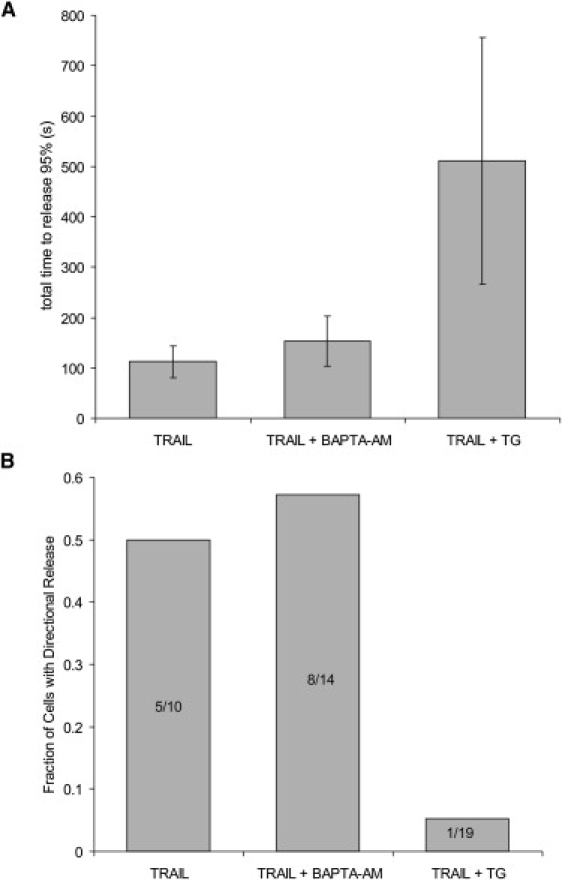
Change in the permeability of the mitochondrial membrane to proteins (cytochrome c and Smac) and protons is a critical step in apoptosis. Although the time from the induction of apoptosis to the change of mitochondrial permeability is variable over a period of hours, the release of proteins is an "all or none" phenomenon that is completed in an individual cell within minutes. Here, using single-cell fluorescence microscopy, we show that the release of cytochrome c from a single mitochondrion occurs in a single step. However, this increased permeability of the outer membrane to cytochrome c propagates throughout the cell as a slower, spatially coordinated wave. The permeability of the outer membrane to Smac propagates with the same spatial pattern but lagging in time. This is followed by a wave of increased permeability of the inner membrane to protons. Only afterward do the mitochondria fission. The spatial dependence of the permeability wave was inhibited by thapsigargin, an inhibitor of the endoplasmic reticulum calcium pumps, but buffering cytosolic calcium had no effect. These results show that the trigger for apoptosis is spatially localized, initiating at one or only a few mitochondria preceding the loss of mitochondrial energetics, and the subsequent temporal propagation of mitochondrial membrane permeability is calcium-dependent.


Figures

Figure 1
Figure 1
Cytochrome c is released in a wave. HeLa cells were cotransfected with cytochrome c-GFP and mito-mCherry, and treated with TRAIL. Selected images are shown with the time of acquisition; t = 0 s indicates the first detected cytochrome c-GFP release. (A) Cytochrome c-GFP fluorescence. The arrow indicates the first release of cytochrome c-GFP. (B) Mito-mCherry fluorescence. (C) Color overlay of cytochrome c-GFP (green), mito-mCherry (red), and colocalization (yellow). (D) The normalized intensity for one ROI versus time for both cytochrome c-GFP (black +) and mito-mCherry (gray ×). (E) Graph of cytochrome c-GFP loss from four separate regions. (F) Plot showing the distance of regions from the first region to release as a function of time of release. All scale bars represent 5 μm.
Figure 2
Figure 2
Three distinct patterns of cytochrome c release. Time-lapse images and quantification of cytochrome c-GFP release in HeLa cells treated with STS; t = 0 s indicates the first detected cytochrome c-GFP release. (A) Images of cytochrome c-GFP release starting at a single point in the cell and (B) the corresponding time-distance correlation plot. (C) Images of cytochrome c-GFP release starting at two points within the cell and (D) the corresponding time-distance correlation plot. (E) Images of cytochrome c-GFP release occurring randomly within the cell and (F) the corresponding time-distance correlation plot. Solid arrows indicate where cytochrome c-GFP release begins and the point from which all distances are measured. All scale bars represent 5 μm.
Figure 3
Figure 3
Loss of mitochondrial membrane potential and Smac release occur after cytochrome c release. (A) The average intensity in a single ROI of cytochrome c-GFP (black +) and TMRE (gray ×) versus time. (B) Plot of cytochrome c-GFP release and TMRE loss as a function of time. (C) Correlation of the time of cytochrome c-GFP release and the loss of potential for all regions. Dotted line indicates simultaneity. (D) The average intensity in a single ROI of cytochrome c-GFP (black +) and Smac-mCherry (gray ×) versus time. (E) Plot of cytochrome c-GFP release and Smac-mCherry release as a function of time. (F) Correlation of the time of cytochrome c-GFP release and the time of Smac-mCherry release for all regions. Dotted line indicates simultaneity.
Figure 4
Figure 4
Mitochondrial fission and release of cytochrome c from single mitochondria. HeLa cells transfected with cytochrome c-GFP and mito-mCherry, and treated with TRAIL. (A) Images of cytochrome c release and mitochondrial fission. Cytochrome c release begins at time t = 0. Arrows indicate sites of fission; arrowheads indicate sites of morphological changes. (B) Line scans of mitochondria from A with mito-mCherry in black and cytochrome c-GFP in gray. Arrows indicate corresponding positions of arrows on image. (C) Release of cytochrome c-GFP from individual mitochondria as revealed by TIR microscopy. Cytochrome c release begins at time t = 0. (D) Quantification of cytochrome c release from different regions of the single mitochondria in C. Release appears to initiate at the same time throughout the mitochondria. Scale bars represent 5 μm.
Figure 5
Figure 5
Thapsigargin, but not BAPTA, disrupts the wave of cytochrome c release. HeLa cells in 1.2 mM EGTA undergoing TRAIL-mediated apoptosis were treated with 1 mM BAPTA-AM (BAPTA) or 5 μM thapsigargin. (A) Duration of cytochrome c release (95% of all ROIs released). Thapsigargin increased the duration of release (p = 2.2 × 10⁻⁶), whereas BAPTA did not (p = 0.025). (B) Bar graph showing the fraction of cells with directional release. Numbers indicate (directionally releasing cells)/(total cells).

References

    1. Ellis R.E., Yuan J.Y., Horvitz H.R. Mechanisms and functions of cell death. Annu. Rev. Cell Biol. 1991;7:663–698. - PubMed
    1. Wyllie A.H. Glucocorticoid-induced thymocyte apoptosis is associated with endogenous endonuclease activation. Nature. 1980;284:555–556. - PubMed
    1. Yuan J., Shaham S., Ledoux S., Ellis H.M., Horvitz H.R. The C. elegans cell death gene ced-3 encodes a protein similar to mammalian interleukin-1 β-converting enzyme. Cell. 1993;75:641–652. - PubMed
    1. Youle R.J., Strasser A. The BCL-2 protein family: opposing activities that mediate cell death. Nat. Rev. Mol. Cell Biol. 2008;9:47–59. - PubMed
    1. Frezza C., Cipolat S., Martins de Brito O., Micaroni M., Beznoussenko G.V. OPA1 controls apoptotic cristae remodeling independently from mitochondrial fusion. Cell. 2006;126:177–189. - PubMed

Publication types

MeSH terms

LinkOut - more resources