. 2010 Jan 15;285(3):1928-38.
doi: 10.1074/jbc.M109.060319. Epub 2009 Oct 20.

IRS1 regulation by Wnt/beta-catenin signaling and varied contribution of IRS1 to the neoplastic phenotype

Affiliations

IRS1 regulation by Wnt/beta-catenin signaling and varied contribution of IRS1 to the neoplastic phenotype

Guido T Bommer et al. J Biol Chem. .

Abstract

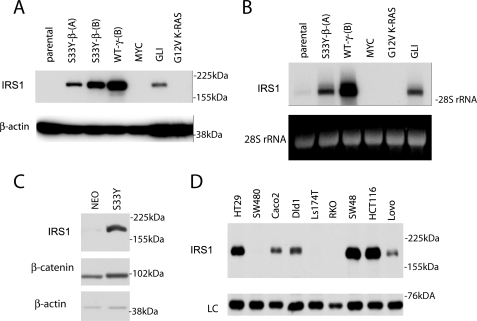
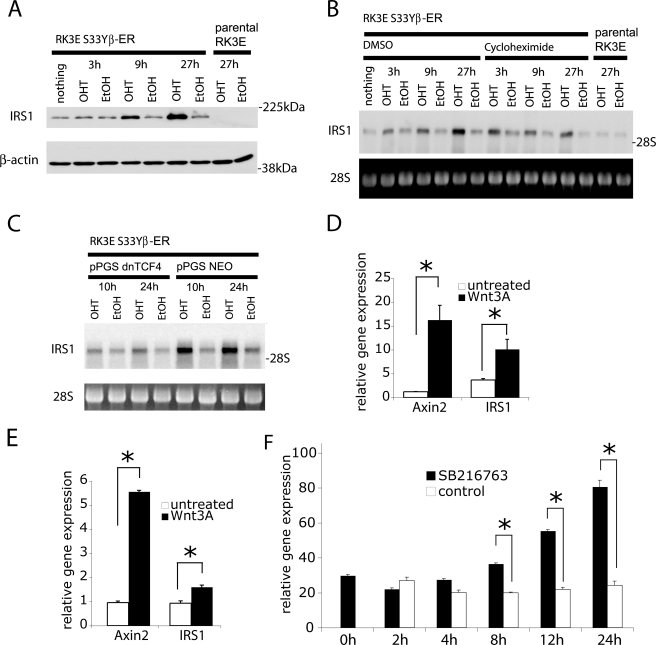
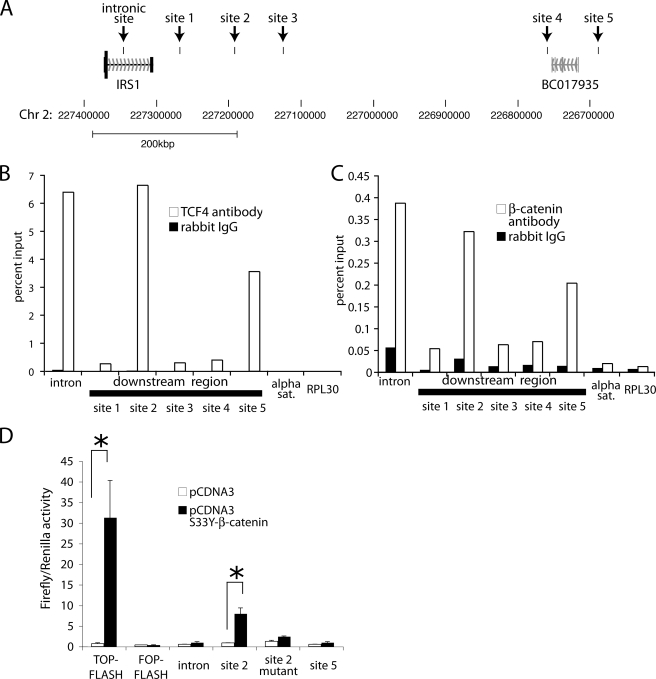
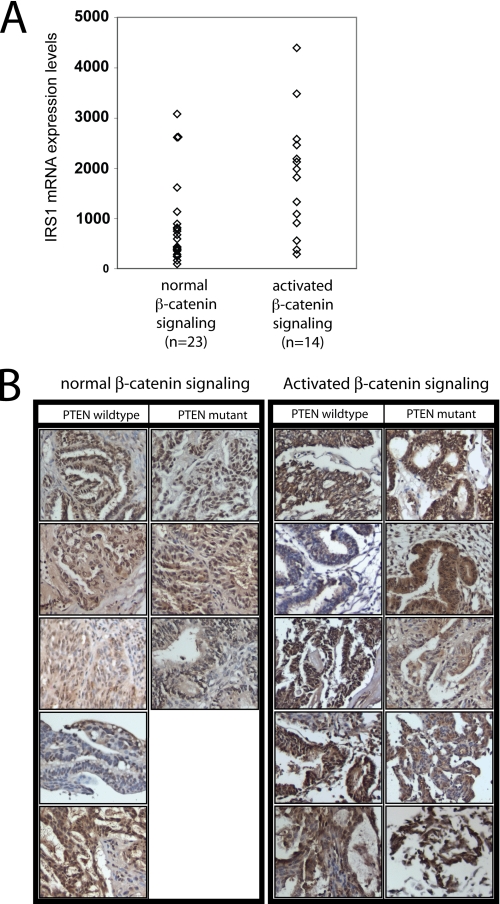
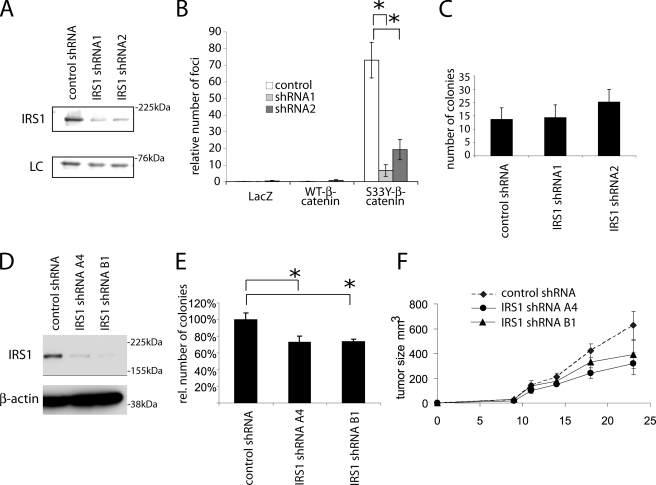
Dysregulation of beta-catenin levels and localization and constitutive activation of beta-catenin/TCF (T cell factor)-regulated gene expression occur in many cancers, including the majority of colorectal carcinomas and a subset of ovarian endometrioid adenocarcinomas. Based on the results of microarray-based gene expression profiling we found the insulin receptor substrate 1 (IRS1) gene as one of the most highly up-regulated genes upon ectopic expression of a mutant, constitutively active form of beta-catenin in the rat kidney epithelial cell line RK3E. We demonstrate expression of IRS1 can be directly activated by beta-catenin, likely in part via beta-catenin/TCF binding to TCF consensus binding elements located in the first intron and downstream of the IRS1 transcriptional start site. Consistent with the proposal that beta-catenin is an important regulator of IRS1 expression in vivo, we observed that IRS1 is highly expressed in many cancers with constitutive stabilization of beta-catenin, such as colorectal carcinomas and ovarian endometrioid adenocarcinomas. Using a short hairpin RNA approach to abrogate IRS1 expression and function, we found that IRS1 function is required for efficient de novo neoplastic transformation by beta-catenin in RK3E cells. Our findings add to the growing body of data implicating IRS1 as a critical signaling component in cancer development and progression.


Figures

FIGURE 1.
FIGURE 1.
IRS1 expression levels are increased by β-catenin signaling in epithelial cells and IRS1 is expressed in the majority of CRC cell lines. A, Western blot and B, Northern blot analyses of parental rat kidney epithelial cell line RK3E and transformed cell lines derived from RK3E cells by transduction of a stabilized mutant of β-catenin (S33Y), wild-type γ-catenin (WTγ), c-MYC, GLI, and G12V mutant KRAS. C, Western blot analysis of IRS1 expression in rat intestinal epithelial cell line IEC18 after transduction of activated β-catenin (S33Y) or empty vector (NEO). D, Western blot analysis of IRS1 expression in selected colorectal carcinoma cell lines. In all panels, equal loading is demonstrated by immunoblotting for β-actin or ethidium bromide staining of 28 S ribosomal RNA, respectively.
FIGURE 2.
FIGURE 2.
The IRS1 gene is a direct target of β-catenin signaling and IRS1 transcript induction by β-catenin does not require protein synthesis. A, Western blot analysis of a polyclonal RK3E cell line expressing a fusion protein of the hormone binding domain of the murine estrogen receptor (RK3E-S33Y-ER) and a stabilized mutant of β-catenin. IRS1 protein levels were determined at the indicated time points after addition of 4-hydroxytamoxifen (4OHT, 500 nm) or a solvent control (Ethanol). B, Northern blot analysis of samples from parental RK3E cells and the RK3E-S33Y-ER cell line stimulated with 4-OHT for the indicated times. Cycloheximide (1.5 μg/ml) or DMSO (i.e. the solvent for cycloheximide) were added 15 min. before treatment with 4-OHT. C, Northern blot analysis of samples from the RK3E-S33Y-ER cell line transduced with a retrovirus to express a dominant-negative mutant of TCF4 (dnTCF4) or control vector. Irs1 mRNA were determined after treatment with 4-OHT or ethanol for 10 and 24 h. In all panels, equal loading is demonstrated by immunoblotting for β-actin or ethidium bromide staining of 28 S ribosomal RNA, respectively. D, IEC6 rat intestinal epithelial cell and E, immortalized ovarian surface epithelium cell lines were treated for 8 h with 50 ng/ml of Wnt3a. Expression of AXIN2 and IRS1 was measured by quantitative PCR and normalized to the expression levels of U6 (D) or HPRT (E), respectively. F, MDAH-2774 cells were treated for the indicated times with the GSK3 inhibitor SB216763. Expression of IRS1 was measured by quantitative PCR and normalized to the expression level of HPRT. Asterisks denote p < 0.05 in Student's t test, and error bars denote S.D.
FIGURE 3.
FIGURE 3.
IRS1 directly binds to downstream enhancers of IRS1. A, schematic representation of the IRS1 locus. Black boxes mark the tested IRS1 binding sites in the intron and downstream of the IRS1 transcript. B, chromatin immunoprecipitation of DLD1 cells using an antibody against TCF4 shows binding to intronic and regions downstream of the IRS1 gene. Relative recovery of the immunoprecipitation was measured by quantitative PCR and is normalized to the amount in the chromatin immunoprecipitation input. Chromatin immunoprecipitation using IgG and amplification of irrelevant multicopy (α-sat) or single copy (RPL30) locus were used demonstrate specificity. Recovery of RPL30 and α-satellite with TCF4 antibody was 0.048 and 0.040%, respectively, which is not visible in this scale. C, chromatin immunoprecipitation using an antibody against β-catenin was performed as described in B. D, 293T cells were transfected with the indicated reporter plasmids containing a minimal promoter and the genomic region encompassing the intronic as well as the strongest binding sites of β-catenin downstream of the IRS1 gene. Firefly luciferase activity in the absence or presence of S33Y β-catenin plasmid were normalized to the activity of a cotransfected constitutively active Renilla luciferase construct. Asterisks denote significance with p < 0.05 in Student's t test, and error bars denote S.D.
FIGURE 4.
FIGURE 4.
IRS1 expression correlates with β-catenin activation in ovarian endometrioid adenocarcinomas. A, expression level of IRS1 as assessed by Affymetrix GeneChip hybridization of ovarian endometroid adenocarcinomas (GSE6008) with or without nuclear β-catenin staining. Significance was assessed using the two-sample t test of log-transformed values. B, immunohistochemical staining for IRS1 expression in ovarian endometrioid adenocarcinomas with or without the activated β-catenin signaling pathway. Tumor samples were subdivided into samples showing inactivation of PTEN or not.
FIGURE 5.
FIGURE 5.
Down-regulation of IRS1 expression by RNA interference reduces β-catenin-dependent neoplastic transformation. A, Western blot analysis of IRS1 protein levels in the S33Y-β-catenin-transformed RK3E cell lines, upon retroviral transduction with constructs driving expression of two different shRNAs targeting Irs1 (shRNA1 and shRNA2) and a nonsilencing control shRNA. To demonstrate equal loading a nonspecific band at 66 kDa is shown. B, transformation of RK3E cells expressing different Irs1 shRNAs after transduction with retroviruses driving expression of a stabilized mutant of β-catenin (S33Y), wild-type β-catenin (WT-β), or β-galactosidase (LacZ). Cells were transduced with the corresponding retroviruses and focus formation was observed for 3 weeks. Bars denote the number of foci and standard deviation from three independent experiments. Representative methylene blue-stained plates are shown in supplemental Fig. S2. C, soft agar colony formation of RK3E cells expressing two different IRS1 shRNAs or a negative control shRNA after transduction with G12V mutant K-Ras. Cells were plated in 0.3% soft agar 2 days after transduction (without selection) and cultured for 2 weeks. Values represent the colony numbers of triplicates, mean ± S.D. Asterisks denote p < 0.05 in Student's t test. D, Western blot analysis of IRS1 protein levels in HT29 colorectal cancer cells upon transduction with retroviruses driving expression of two different shRNAs targeting IRS1 (shRNA-A4 and shRNA-B1) or a nonsilencing control shRNA. To demonstrate equal loading β-actin levels are shown. E, soft agar colony formation of the cells from D. Colony numbers are represented relative to the number of colonies in the cell line expressing a nonsilencing shRNA. Values are mean and S.D. of three experiments performed in triplicates. F, xenograft tumor growth after subcutaneous injection of the cells from C in immunocompromised nude mice. Five mice for each group were injected on both flanks (i.e. 10 tumors per group). Asterisks denote significance with p < 0.05 in Student's t test, and error bars represent mean ± S.E.

References

    1. Moon R. T., Kohn A. D., De Ferrari G. V., Kaykas A. (2004) Nat. Rev. Genet. 5, 691–701 - PubMed
    1. Clevers H. (2006) Cell 127, 469–480 - PubMed
    1. Polakis P. (2007) Curr. Opin. Genet. Dev. 17, 45–51 - PubMed
    1. Städeli R., Hoffmans R., Basler K. (2006) Curr. Biol. 16, R378–R385 - PubMed
    1. Sakatani T., Kaneda A., Iacobuzio-Donahue C. A., Carter M. G., de Boom Witzel S., Okano H., Ko M. S., Ohlsson R., Longo D. L., Feinberg A. P. (2005) Science 307, 1976–1978 - PubMed

Publication types