. 2009 Dec 18;284(51):35850-60.
doi: 10.1074/jbc.M109.071670.

Live cell analysis of aquaporin-4 m1/m23 interactions and regulated orthogonal array assembly in glial cells

Affiliations

Live cell analysis of aquaporin-4 m1/m23 interactions and regulated orthogonal array assembly in glial cells

Jonathan M Crane et al. J Biol Chem. .

Abstract

Aquaporin-4 (AQP4) can assemble into supramolecular aggregates called orthogonal arrays of particles (OAPs). In cells expressing single AQP4 isoforms, we found previously that OAP formation by AQP4-M23 requires N terminus interactions just downstream of Met-23 and that the inability of AQP4-M1 to form OAPs involves blocking by residues upstream of Met-23. Here, we studied M1/M23 interactions and regulated OAP assembly by nanometer-resolution tracking of quantum dot-labeled AQP4 in live cells expressing differentially tagged AQP4 isoforms and in primary glial cell cultures in which native AQP4 was labeled with a monoclonal recombinant neuromyelitis optica autoantibody. OAP assembly was assessed independently by Blue Native gel electrophoresis. We found that OAPs in native glial cells could be reproduced in transfected cells expressing equal amounts of AQP4-M1 and -M23. Mutants of M23 that do not themselves form OAPs, including M23-F26Q and M23-G28P, were able to fully co-associate with native M23 to form large immobile OAPs. Analysis of a palmitoylation-null M1 mutant (C13A/C17A) indicated palmitoylation-dependent OAP assembly only in the presence of M23, with increased M1 palmitoylation causing progressive OAP disruption. Differential regulation of OAP assembly by palmitoylation, calcium elevation, and protein kinase C activation was found in primary glial cell cultures. We conclude that M1 and M23 co-assemble in AQP4 OAPs and that specific signaling events can regulate OAP assembly in glial cells.


Figures

FIGURE 1.
FIGURE 1.
Labeling strategy for two-color single particle tracking. A, a AQP4 schematic shows Met-1 and Met-23 (black circles) in the cytoplasmic N terminus, transmembrane helices (gray), the positions of inserted Myc or HA sequence (orange) in the second extracellular loop, and consensus protein kinase A (cyan) and protein kinase C (yellow) phosphorylation sites. The expanded blue box shows the N-terminal sequence of AQP4 with potential sites of palmitoylation in M1 (green) and sites of mutation that reduce OAP formation in M23 (red). B, immunofluorescence of COS-7 cells transfected with M1.Myc (top), M23.HA (middle), or both (bottom) and stained with anti-Myc (green) or anti-HA (red) antibodies is shown. Nuclei were stained with 4′,6-diamidino-2-phenylindole (blue). Bar, 50 μm. C, shown are representative trajectories of Qdot-labeled COS-7 cells at 37 °C transfected individually with M1.Myc (green) or M23.HA (red). Bar, 1 μm. D and E, shown is combined mean-squared displacement and cumulative distribution of the range at 1 s from COS-7 cells transfected with M23.Myc and labeled with 655 nm Qdots (black), M23.HA labeled with 655 nm Qdots (red), M1.Myc labeled with 655 nm Qdots (gray), and M1.Myc labeled with 605 nm Qdots (green).
FIGURE 2.
FIGURE 2.
OAP modulation by co-expression of M1 and M23 isoforms in COS-7 cells. A, shown is the cumulative distribution of the range of AQP4 isoforms in COS-7 cells transfected with M23 only (black) or M1 only (gray) or co-transfected with M23 (red) and M1 (green) at M23-to-M1 ratios of 3:1 (top), 1:1 (middle), or 1:3 (bottom). B, shown are the combined distributions comparing all AQP4 diffusion when M1 and M23 were transfected together (solid) or separately (dashed), derived by summing P(range) curves in panel A weighted by the relative amounts. C, shown are immunoblots after BN-PAGE (top) and SDS-PAGE (bottom) of lysates from COS-7 cells transfected with AQP4 at indicated M23-to-M1 ratios and labeled with anti-AQP4. D, shown are immunoblots after BN-PAGE of the same cell lysates as in panel C but labeled with anti-HA (left) or anti-Myc (right) to identify individual AQP4 isoforms.
FIGURE 3.
FIGURE 3.
S-Palmitoylation of AQP4-M1 regulates OAP assembly. A, shown is cumulative distribution of the range of M23 (red) and M1 (green) in co-transfected cells after incubation with BrPA for 1 h (left), 8 h (middle), or 16 h (right) compared with the combined distribution (see Fig. 2B) without BrPA (black). B, shown are M23 alone (black, red) and M1 alone (gray, green) without and after overnight exposure to BrPA, respectively. C, shown are M1 mutants M1-C13A (top), M1-C17A (middle), or M1-C13A/C17A (bottom) and M23 in co-transfected cells (M23, red; M1 mutants, green), or separately transfected cells (M23, black; M1, mutants, gray). D, shown are co-transfected M23 (red) and M1 cysteine mutants (green) after overnight exposure to BrPA compared with combined distributions without BrPA (black). E, box plot is shown summarizing the diffusion of M23, M1, and M1 cysteine mutants without (white) and after (gray) overnight exposure to BrPA. Vertical lines in the box centers represent the median, with left and right boundaries representing the 25th and 75th percentiles of the range, respectively. Experiments were done on COS-7 cells with co-transfections at equimolar ratios.
FIGURE 4.
FIGURE 4.
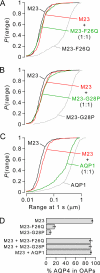
OAP-null mutants of M23 do not regulate OAP assembly. A–C, shown is the cumulative distribution of the range of AQP4 mutants M23-F26Q (A), M23-G28P (B), or homolog AQP1 (C) and M23 in co-transfected cells (M23, red; other, green) or separately transfected cells (M23, black; other, gray). D, the estimated percentage of AQP4 molecules assembled in OAPs based on the 95th percentile of range for pure M23 is shown. Error bars represent the S.E.
FIGURE 5.
FIGURE 5.
A recombinant AQP4-specific antibody (rAb-53) stains native AQP4 within and outside of OAPs. A, immunofluorescence of COS-7 cells transfected with human, mouse, and rat M23 and M1 AQP4 is shown. Cell surface was stained (green) with rAb-53 (left), NMO patient serum (middle), or control serum (right). Also shown is the staining of fixed, permeabilized cells with C terminus-targeted anti-AQP4 (red). B, immunofluorescence shows surface staining of primary glial cell cultures from wild-type (left) and AQP4 knock-out (right) mice with rAb-53 (green). Nuclei were stained with 4′,6-diamidino-2-phenylindole (blue). Bar, 50 μm. C, AQP4 immunoblots are shown after BN-PAGE (top) and SDS-PAGE (bottom) of lysates from cultured astrocytes from wild-type (+/+) and AQP4 knock-out (−/−) mice (left) and brain tissue lysates (right).
FIGURE 6.
FIGURE 6.
Regulation of AQP4 diffusion in primary glial cell cultures. A, left, shown is the cumulative distribution of the range of M1 and M23 AQP4 isoforms from human (red), rat (green), and mouse (blue) individually transfected into COS-7 cells. Right, shown are mouse M23 (black) and M1 (gray) transfected into primary glial cell cultures from AQP4 knock-out mice and AQP4 in glial cell cultures from wild-type mice (red). B, a box plot summarizing AQP4 diffusion in transfected COS-7 cells (top) and primary glial cell cultures (bottom) is shown. C, histograms show ranges of M23 and M1 separately transfected into glial cell cultures from AQP4 knock-out mice. Black curves represent best fit to a gamma distribution (Equation 3). D, left, histograms of AQP4 ranges in glial cells from wild-type mice are shown. The red curve represent the best fit to a sum of two gamma distributions (black curves). Right, shown is a comparison of distributions representing diffusion in OAPs consisting of M23 only (black) and OAPs in wild-type cells (red). *, p < 0.05. E, top, shown is the cumulative distribution of the range of AQP4 in wild-type glial cell cultures (red) and after overnight exposure to BrPA (green). Bottom, AQP4 in wild-type glial cell cultures after 10 min of exposure to thapsigargin (green), forskolin (blue), or PMA (orange) is shown. M1 (gray) and M23 (black) are shown for comparison. F, shown are histograms of ranges with colors corresponding to panel E after mathematical deconvolution of populations as shown in panel D. G, estimated percentage of AQP4 molecules assembled in OAPs with indicated treatments are shown based on deconvolution of populations as shown in panel D. Error bars represent S.D. *, p < 0.05 when compared with untreated cells.

References

    1. Nielsen S., Nagelhus E. A., Amiry-Moghaddam M., Bourque C., Agre P., Ottersen O. P. (1997) J. Neurosci. 17, 171–180 - PMC - PubMed
    1. Rash J. E., Yasumura T., Hudson C. S., Agre P., Nielsen S. (1998) Proc. Natl. Acad. Sci. U.S.A. 95, 11981–11986 - PMC - PubMed
    1. Manley G. T., Fujimura M., Ma T., Noshita N., Filiz F., Bollen A. W., Chan P., Verkman A. S. (2000) Nat. Med. 6, 159–163 - PubMed
    1. Saadoun S., Bell B. A., Verkman A. S., Papadopoulos M. C. (2008) Brain 131, 1087–1098 - PubMed
    1. Yang B., Zador Z., Verkman A. S. (2008) J. Biol. Chem. 283, 15280–15286 - PMC - PubMed

Publication types

MeSH terms