. 2009 Nov 1;183(9):5458-67.
doi: 10.4049/jimmunol.0803217.

1,25-Dihydroxyvitamin D3 and IL-2 combine to inhibit T cell production of inflammatory cytokines and promote development of regulatory T cells expressing CTLA-4 and FoxP3

Affiliations

1,25-Dihydroxyvitamin D3 and IL-2 combine to inhibit T cell production of inflammatory cytokines and promote development of regulatory T cells expressing CTLA-4 and FoxP3

Louisa E Jeffery et al. J Immunol. .

Abstract

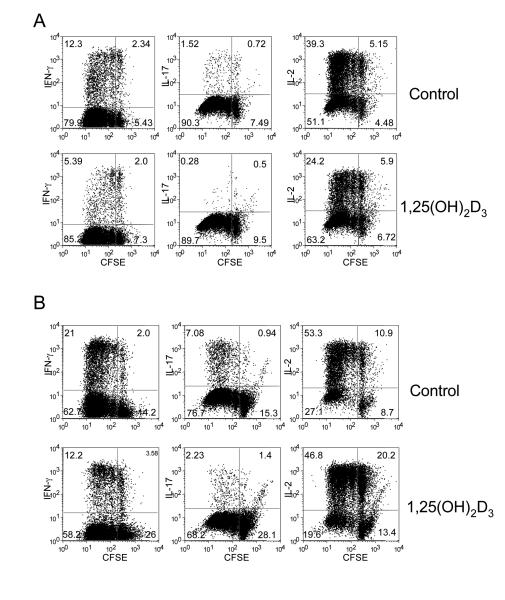
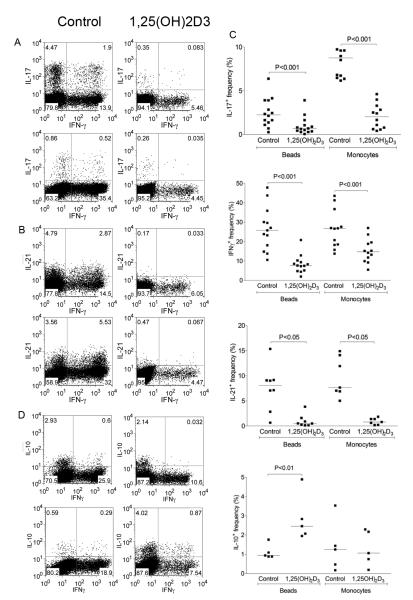
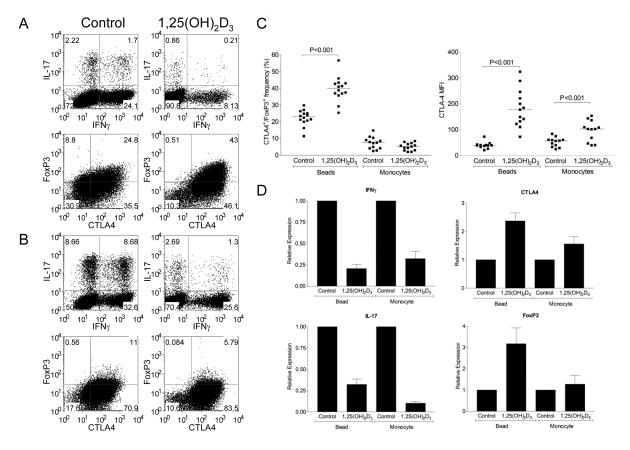
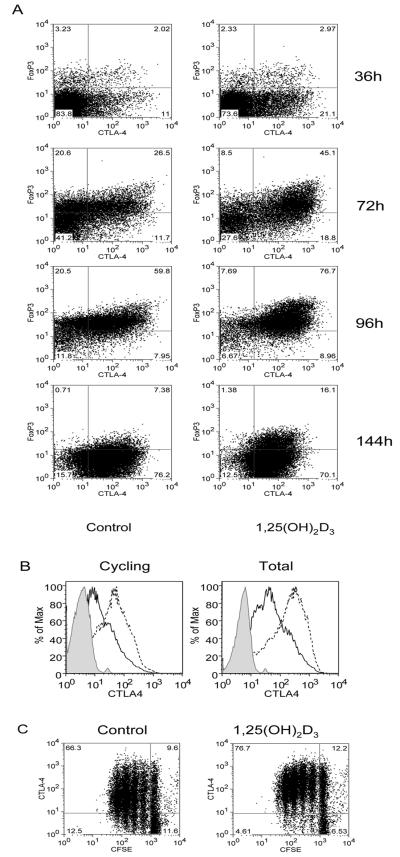
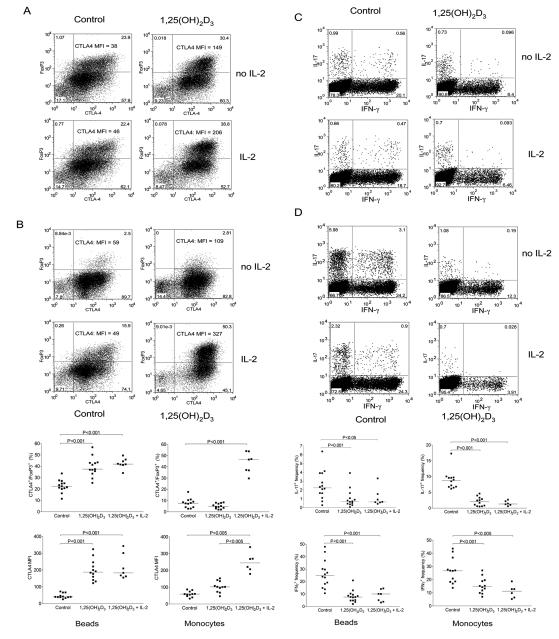
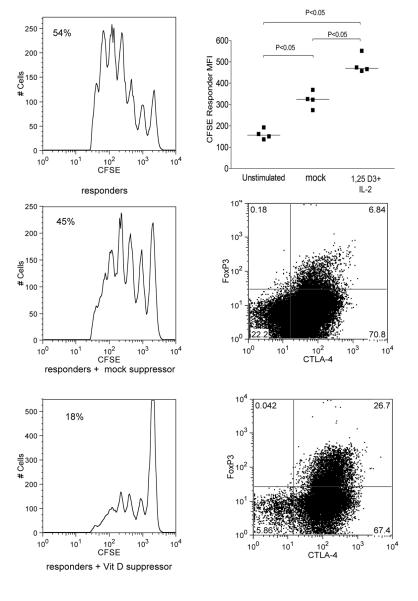
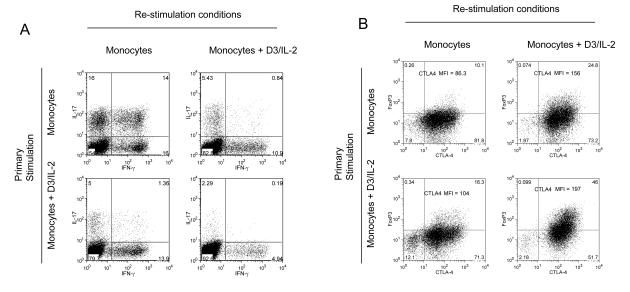
The active form of vitamin D, 1,25-dihydroxyvitamin D(3) (1,25(OH)(2)D(3)), has potent immunomodulatory properties that have promoted its potential use in the prevention and treatment of infectious disease and autoimmune conditions. A variety of immune cells, including macrophages, dendritic cells, and activated T cells express the intracellular vitamin D receptor and are responsive to 1,25(OH)(2)D(3.) Despite this, how 1,25(OH)(2)D(3) regulates adaptive immunity remains unclear and may involve both direct and indirect effects on the proliferation and function of T cells. To further clarify this issue, we have assessed the effects of 1,25(OH)(2)D(3) on human CD4(+)CD25(-) T cells. We observed that stimulation of CD4(+)CD25(-) T cells in the presence of 1,25(OH)(2)D(3) inhibited production of proinflammatory cytokines including IFN- gamma, IL-17, and IL-21 but did not substantially affect T cell division. In contrast to its inhibitory effects on inflammatory cytokines, 1,25(OH)(2)D(3) stimulated expression of high levels of CTLA-4 as well as FoxP3, the latter requiring the presence of IL-2. T cells treated with 1,25(OH)(2)D(3) could suppress proliferation of normally responsive T cells, indicating that they possessed characteristics of adaptive regulatory T cells. Our results suggest that 1,25(OH)(2)D(3) and IL-2 have direct synergistic effects on activated T cells, acting as potent anti-inflammatory agents and physiologic inducers of adaptive regulatory T cells.


Figures

Figure 1
Figure 1. 1,25(OH)2D3 inhibits T cell cytokine production without affecting cell division
(A) Purified CD4+CD25 T cells were CFSE-labelled and stimulated with anti-CD3/CD28 coated beads in the presence or absence of 100nM 1,25(OH)2D3 for 5 days. Following stimulation cells were stained for IL-2, IFN-γ and IL-17 production and analysed for cell division by FACS. (B) Purified CD4+CD25 were treated as in A except that cells were stimulated with autologous monocytes plus anti-CD3. Data is from a single experiment representative of 3 performed.
Figure 2
Figure 2. 1,25(OH)2D3 inhibits IL-17, IFN-γ and IL-21 but promotes IL-10
Purified CD4+CD25 T cells were stimulated with anti-CD3/CD28 coated beads or autologous monocytes plus anti-CD3 (0.1μg/ml) in the presence of 100nM 1,25(OH)2D3 or vehicle control for 5 days. Following stimulation cells were stained for IFN-γ and co stained for IL-17 (A) IL-21 (B) and IL-10 (D). Upper panels were stimulated with autologous monocytes plus anti-CD3 and lower panels with beads. Data from multiple experiments are represented in panel C. Horizontal bars indicate the median frequency. Significance was tested by a two-tailed Wilcoxon matched pairs test.
Figure 3
Figure 3. 1,25(OH)2D3 promotes expression of CTLA-4 and FoxP3
Purified CD4+CD25 T cells were stimulated with anti-CD3/CD28 coated beads (A) or autologous monocytes plus anti-CD3 (0.1μg/ml) (B) in the presence of 100nM 1,25(OH)2D3 or vehicle control for 5 days. Following stimulation cells were stained for total expression of CTLA-4 and FoxP3 or IFN-γ and IL-17. Numbers in quadrants refer to percentage of cells. Data from multiple experiments for CTLA-4 and FoxP3 expression are represented in panel C. Horizontal bars indicate the median value and significance was tested by a two-tailed Wilcoxon matched pairs test. Quantitative PCR analysis of mRNA expression for CTLA-4, FoxP3, IL-17 and IFNγ is shown in D. Bars indicate the mean relative expression with respect to the control for n=3 donors. Error bars show the standard error.
Figure 4
Figure 4. Expression of FoxP3 is not stably maintained by 1,25(OH)2D3
(A) Purified CD4+CD25 T cells were stimulated with anti-CD3/CD28 coated beads in the presence of 100nM 1,25(OH)2D3 or vehicle control for the times shown. Cells were analysed for expression of CTLA-4 and FoxP3. (B) Expression was determined for both the total and re-cycling pool of CTLA-4. Dotted lines indicate expression in the presence of 1,25(OH)2D3 whereas black lines indicate vehicle control. The shaded histogram represents isotype control staining. (C) CFSE labelled CD4+ CD25 T cells were stimulated as above and analysed for CTLA-4 expression in combination with cell division. Numbers in quadrants refer to percentage of cells. Data shown is from a single experiment representative of 3 carried out.
Figure 5
Figure 5. 1,25(OH)2D3 and IL-2 synergise to promote regulatory T cell development and inhibit inflammatory cytokine production
(A + C) CD4+CD25 T cells were stimulated with anti-CD3/CD28 coated beads in the presence of 100nM 1,25(OH)2D3 or vehicle control with or without the addition of IL-2 (200IU/ml). (B + D) Purified CD4+CD25 were stimulated with autologous monocytes plus anti-CD3 in the presence of 100nM 1,25(OH)2D3 or vehicle control with or without the addition of IL-2 (200IU/ml). Cells were analysed for CTLA-4 and FoxP3 expression panels A and B or for cytokine expression (C and D). Numbers in quadrants refer to percentage of cells. CTLA-4 MFI is also shown. Summary data from multiple independent experiments are show in panel E. Horizontal bars indicate median values. Significance was tested using a two-tailed Wilcoxon matched pairs test.
Figure 6
Figure 6. T cell culture in the presence of 1,25(OH)2D3 and IL-2, results in suppressive function
Suppressor CD4+ T cells were generated by stimulating purified CD4+CD25 with autologous monocytes plus anti-CD3 in the presence of 100nM 1,25(OH)2D3 and addition of IL-2 (200IU/ml) for 7 days. Cells cultured without 1,25(OH)2D3 and IL-2 were used as mock-suppressor populations. Suppressor mock-suppressor populations were added at a ratio of 1:10 CFSE labelled responder T cells and stimulated by dendritic cells plus anti-CD3 at a ratio of 1:5 DCs : T cells. Responses were also compared to unstimluated, (resting CD4+ cells) as suppressor controls. Responder CFSE profiles are shown with the % cells entering cell division (left panels) along with the phenotype of suppressor and mock-suppressor cells (right panel).CFSE profiles are from a single experiment of four performed. Data showing individual experiments are summarised as median fluorescence intensity (CFSE responder MFI) in the top right panel. Data were analysed using the Mann-Whitney test. Dot plots show typical expression of CTLA-4 and FoxP3 in cells with and without treatment with 1,25(OH)2D3 plus IL-2.
Figure 7
Figure 7. Effect of 1,25(OH)2D3 and IL-2 is maintained on activated T cells
CD4+CD25 T cells were stimulated in primary culture with monocytes and anti-CD3 for 7 days with or without1,25(OH)2D3 plus IL-2 (D3/IL-2) (y axis) and then re-stimulated with monocytes and anti-CD3 for a further 4 days under conditions shown (x-axis). The phenotype of the re-stimulated cells was then assessed for cytokine production (panel A) or FoxP3 and CTLA-4 expression (Panel B). Numbers in quadrants refer to percentage of cells and CTLA-4 MFI intensity is also shown. Data are from a single experiment representative of 3 performed.

References

    1. O’Garra A, Murphy K. Role of cytokines in determining T-lymphocyte function. Curr Opin Immunol. 1994;6:458–466. - PubMed
    1. Bettelli E, Oukka M, Kuchroo VK. T(H)-17 cells in the circle of immunity and autoimmunity. Nat Immunol. 2007;8:345–350. - PubMed
    1. Vogelzang A, McGuire HM, Yu D, Sprent J, Mackay CR, King C. A fundamental role for interleukin-21 in the generation of T follicular helper cells. Immunity. 2008;29:127–137. - PubMed
    1. Happel KI, Dubin PJ, Zheng M, Ghilardi N, Lockhart C, Quinton LJ, Odden AR, Shellito JE, Bagby GJ, Nelson S, Kolls JK. Divergent roles of IL-23 and IL-12 in host defense against Klebsiella pneumoniae. J Exp Med. 2005;202:761–769. - PMC - PubMed
    1. Langrish CL, Chen Y, Blumenschein WM, Mattson J, Basham B, Sedgwick JD, McClanahan T, Kastelein RA, Cua DJ. IL-23 drives a pathogenic T cell population that induces autoimmune inflammation. J Exp Med. 2005;201:233–240. - PMC - PubMed

Publication types

MeSH terms