. 2009 Oct 20;2(93):ra65.
doi: 10.1126/scisignal.2000599.

A noisy paracrine signal determines the cellular NF-kappaB response to lipopolysaccharide

Affiliations

A noisy paracrine signal determines the cellular NF-kappaB response to lipopolysaccharide

Timothy K Lee et al. Sci Signal. .

Abstract

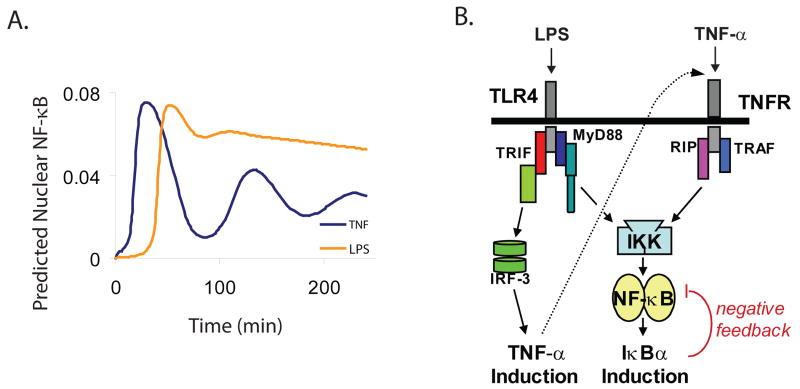
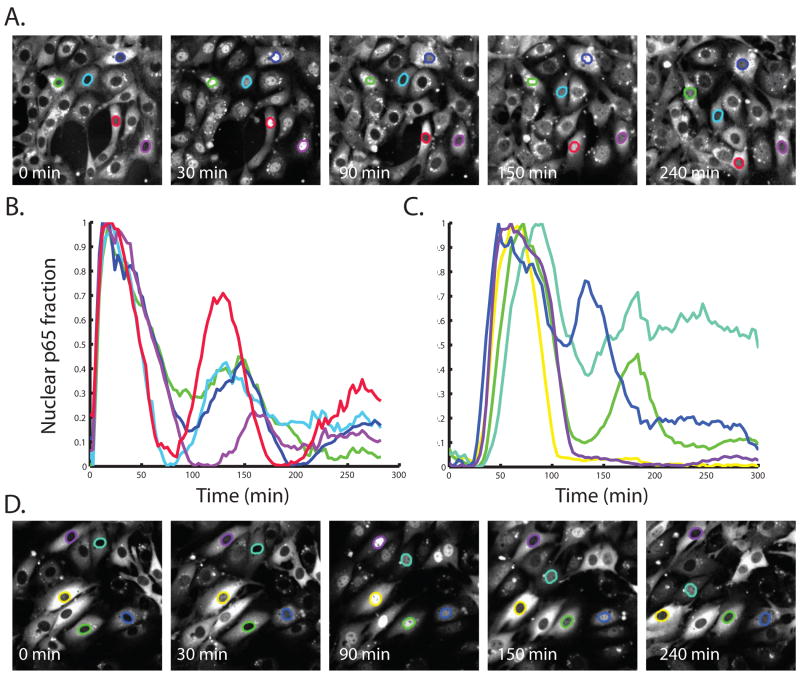
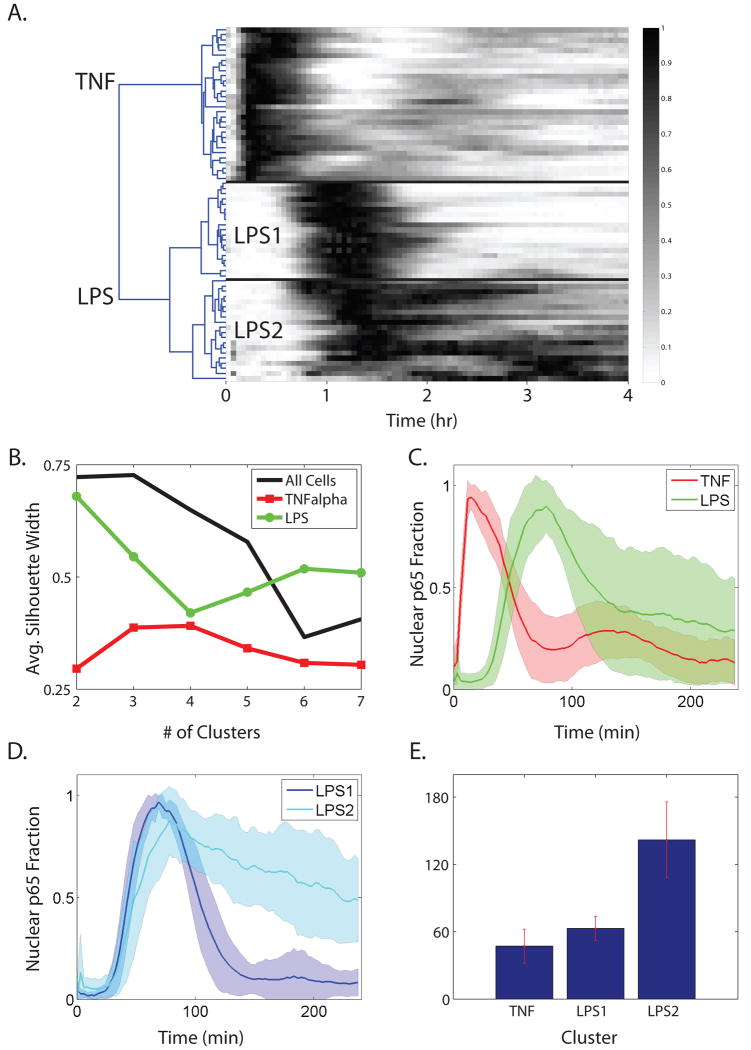
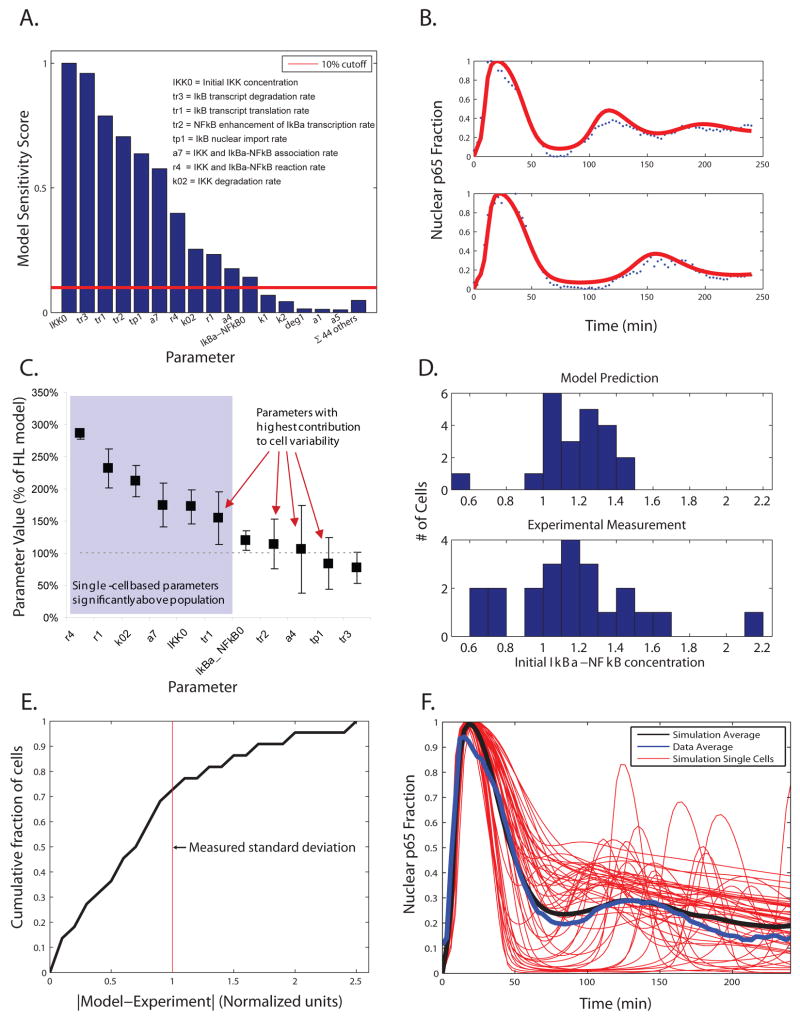
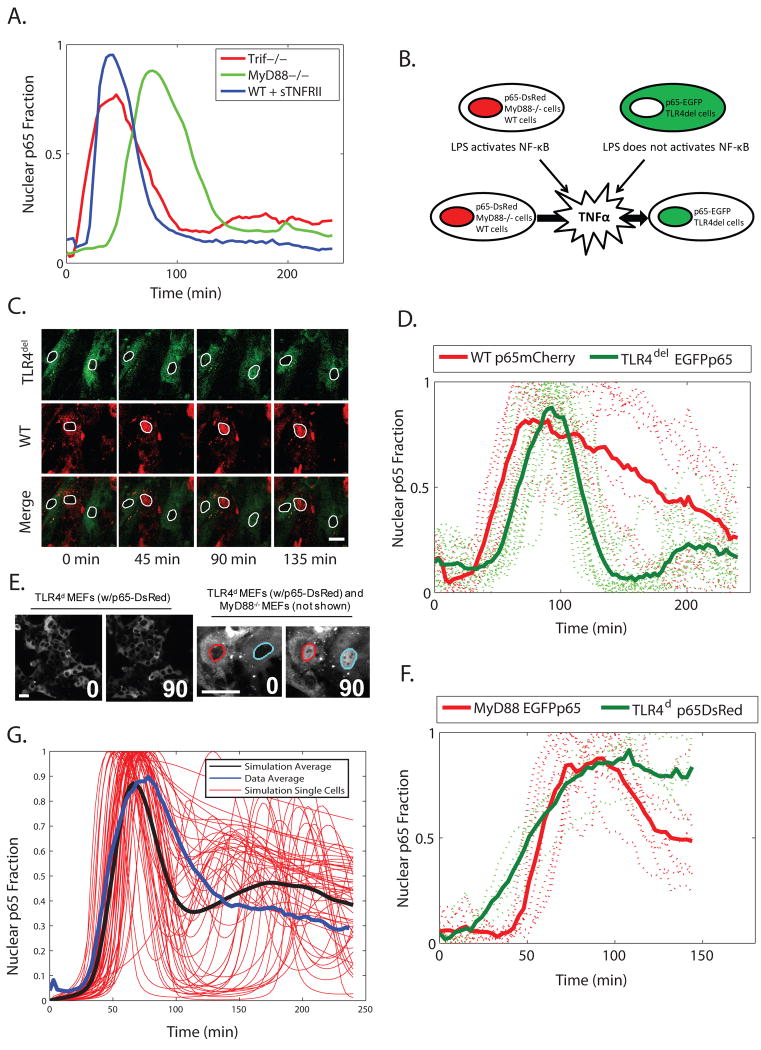
Nearly identical cells can exhibit substantially different responses to the same stimulus. We monitored the nuclear localization dynamics of nuclear factor kappaB (NF-kappaB) in single cells stimulated with tumor necrosis factor-alpha (TNF-alpha) and lipopolysaccharide (LPS). Cells stimulated with TNF-alpha have quantitative differences in NF-kappaB nuclear localization, whereas LPS-stimulated cells can be clustered into transient or persistent responders, representing two qualitatively different groups based on the NF-kappaB response. These distinct behaviors can be linked to a secondary paracrine signal secreted at low concentrations, such that not all cells undergo a second round of NF-kappaB activation. From our single-cell data, we built a computational model that captures cell variability, as well as population behaviors. Our findings show that mammalian cells can create "noisy" environments to produce diversified responses to stimuli.


Figures

Fig. 1
Fig. 1. LPS and TNF-α signal through separate receptors and pathways to trigger NF-κB activation with different dynamics
(A) Population-based computational models of NF-κB nuclear localization (20, 28). (B) A schematic of NF-κB activation by TNF-α and LPS. Dashed line from TNF-α induction to TNFR represents secretion of TNF-α. The red and green proteins associated with TLR4 are TRAM and TRIF, respectively. The dark blue and teal blue proteins associated with TLR4 are Mal and Myd88, respectively.
Fig. 2
Fig. 2. NF-κB nuclear localization exhibits oscillatory dynamics when cells are stimulated with TNF-α but stable nuclear accumulation when cells are stimulated with LPS
(A and D) Single-cell images of EGFP-p65 transduced relA-/- 3T3 cells exposed to TNF-α (A) or LPS (D) for the indicated times. (B) Time course showing the NF-κB localization in the cells in A. (C) Time course showing the NF-κB localization in the cells in B. The colors used to highlight nuclei in (A) and (D) correspond to traces in (B) and (C). Time course data were normalized by the minimum and maximum value of nuclear NF-κB during the time course to account for the varying overall intensities in different cells. All scale bars represent 25 μm.
Fig. 3
Fig. 3. NF-κB nuclear localization time courses can be clustered into distinct groups
(A) Cluster diagram for 69 cells observed in 8 different experiments, clustered hierarchically using angle cosine as a distance metric between time courses. The diagram is organized and shaded to resemble a series of gel shift assay results stacked on top of each other. (B) Average silhouette widths for different subsets of the dataset calculated for variable number of clusters. (C) TNF-α- and LPS-stimulated cells can be separated into two separate groups on the basis of the dynamics of the initial NF-κB activiation. (D) LPS-stimulated cells can be further separated into two clusters. The shaded areas in C and D correspond to the standard deviation of the cluster around the cluster average. (E) Duration of time where nuclear p65-EGFP was greater than 50% of the maximal value for each cluster.
Fig. 4
Fig. 4. Characterizing and modeling the quantitative differences in NF-κB localization dynamics for TNF-α-stimulated cells
(A) Sensitivity analysis of the base HL model. Each parameter in the model was varied +/- 50% and the distance between the resulting simulations and the base model were calculated and added as shown. We chose parameters for which the score was 10% or higher of the maximum value. (B) Fitting the parameters to single-cell data. The eleven parameters identified in A were fit to cellular NF-κB activation time courses as described in Materials and Methods. Two representative fits are shown and the remaining fits can be found in fig. S3. (C) The resulting distributions for all sets, shown as an average and standard deviation as a percentage of the base HL model (100%, dashed line) value. The distributions most closely fit a mixture of Gaussians, with parameters as shown in table S1. (D) Distribution of fitted and experimental values for the parameter IκBα_NFκB0 (the initial concentration of the IκBα and NF-κB complex). (E) Correlation between model fit and experimental measurement plotted as the cumulative fraction of cells versus error. (F) Representative and average results from a set of ten thousand model simulations where the values of the eleven parameters were chosen randomly from each distribution.
Fig. 5
Fig. 5. A noisy paracrine signal determines the cellular NF-κB response to LPS
(A) Average NF-κB nuclear localization in Trif-/- MEFs and in MyD88-/- MEFs, as well as wild-type 3T3 cells (WT) pre-treated with soluble TNF-α receptor (sTNFRII), over time. (B) Schematic of the approach to assess paracrine signaling by TNF-α. Wild-type or MyD88-/- and TLR4-deficient (TLRdel or TLRd) cells are grown together, each labeled with a different color of fluorescent protein. Activation of NF-κB in TLRdel would occur through the paracrine pathway (Fig. 1B). (C) TLR4del and wild-type MEFs cultured together and stimulated with LPS (5 μg/ml). Nuclei are outlined for clarity. (D) Single-cell traces for the experiments presented in C. Bold lines correspond to average behavior. (E) TLR4d and MyD88-/- MEFs cultured together and stimulated with LPS (0.5 μg/ml). TLR4d cells do not respond to LPS (left), but do respond in the presence of MyD88-/- MEFs (right). Although not present in the field imaged, MyD88-/- MEFs were present in the culture. (F) Single-cell traces for the experiments presented in E. Bold lines correspond to average behavior. (G) Representative and average results from a set of ten thousand model simulations where activation of the TRIF-dependent pathway occurs as a random event. All scale bars represent 25 μm.

References

    1. Maamar H, Raj A, Dubnau D. Noise in gene expression determines cell fate in Bacillus subtilis. Science. 2007;317:526–9. - PMC - PubMed
    1. Suel GM, Garcia-Ojalvo J, Liberman LM, Elowitz MB. An excitable gene regulatory circuit induces transient cellular differentiation. Nature. 2006;440:545–50. - PubMed
    1. Suel GM, Kulkarni RP, Dworkin J, Garcia-Ojalvo J, Elowitz MB. Tunability and noise dependence in differentiation dynamics. Science. 2007;315:1716–9. - PubMed
    1. Balaban NQ, Merrin J, Chait R, Kowalik L, Leibler S. Bacterial persistence as a phenotypic switch. Science. 2004;305:1622–5. - PubMed
    1. Wernet MF, Mazzoni EO, Celik A, Duncan DM, Duncan I, Desplan C. Stochastic spineless expression creates the retinal mosaic for colour vision. Nature. 2006;440:174–80. - PMC - PubMed