Comparative Study
. 2010 Jan-Feb;30(1):5-15.
doi: 10.1177/0272989X09347016. Epub 2009 Oct 20.

Comparison of 5 health-related quality-of-life indexes using item response theory analysis

Affiliations
Comparative Study

Comparison of 5 health-related quality-of-life indexes using item response theory analysis

Dennis G Fryback et al. Med Decis Making. 2010 Jan-Feb.

Abstract

Background: Five health-related quality-of-life (HRQoL) indexes--EQ-5D, HUI2, HUI3, QWB-SA, and SF-6D--are each used to assign community-based utility scores to health states, although these scores differ.

Objective: The authors transform these indexes to a common scale to understand their interrelationships.

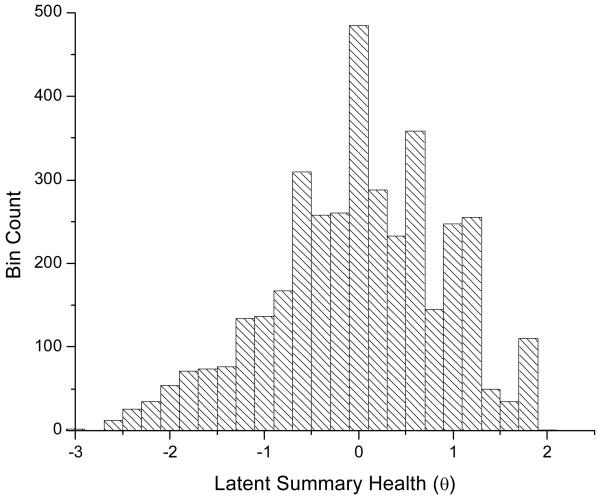
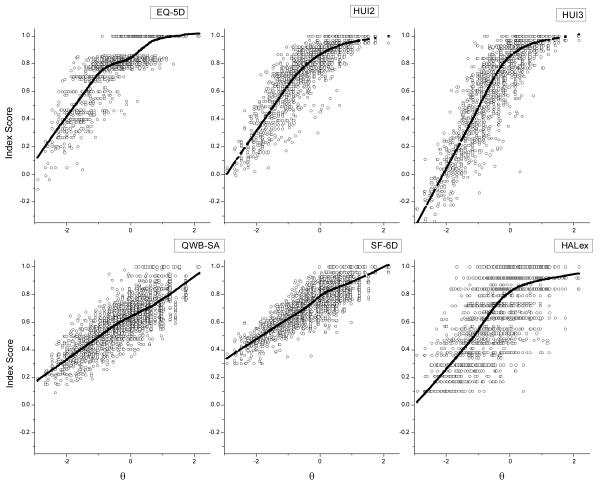
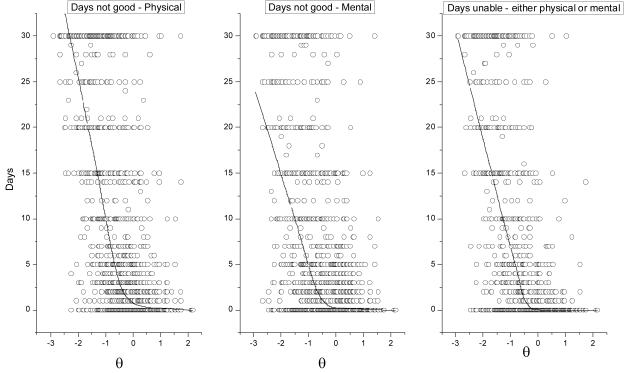
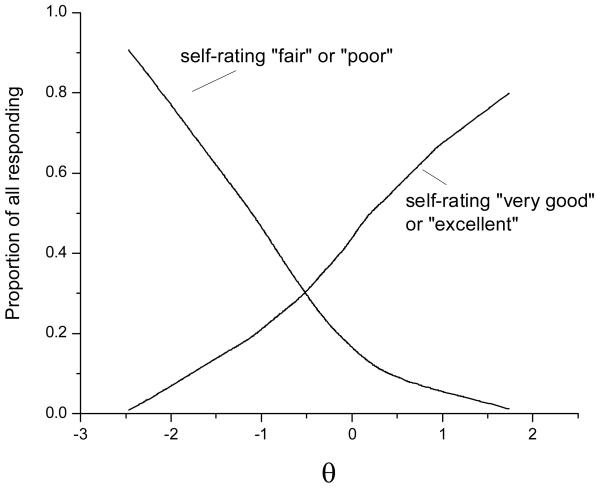
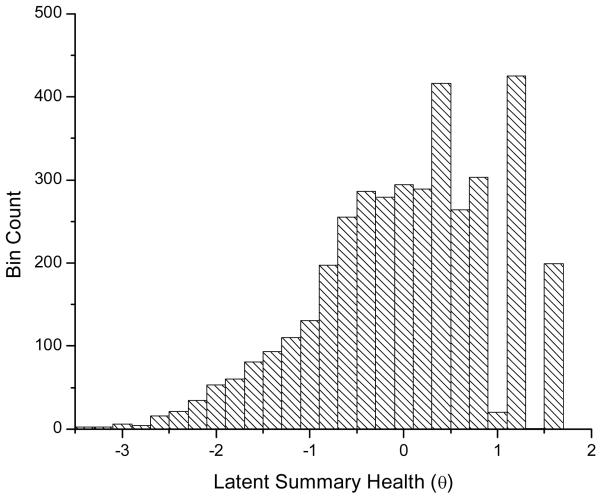
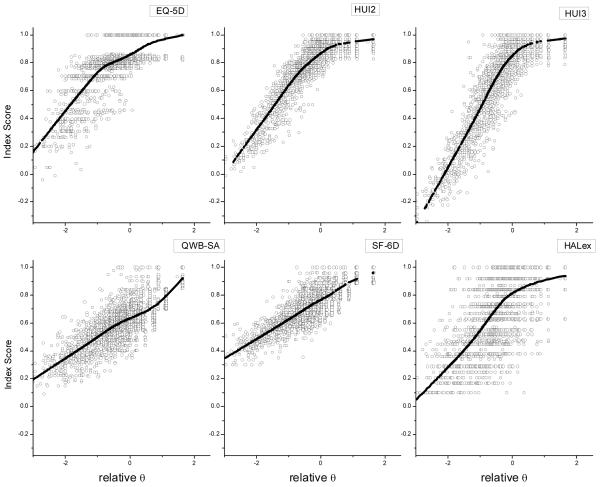
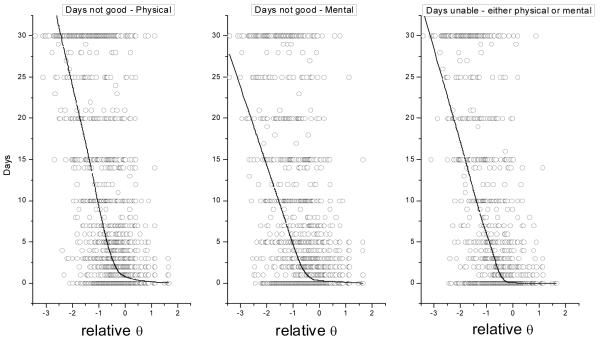
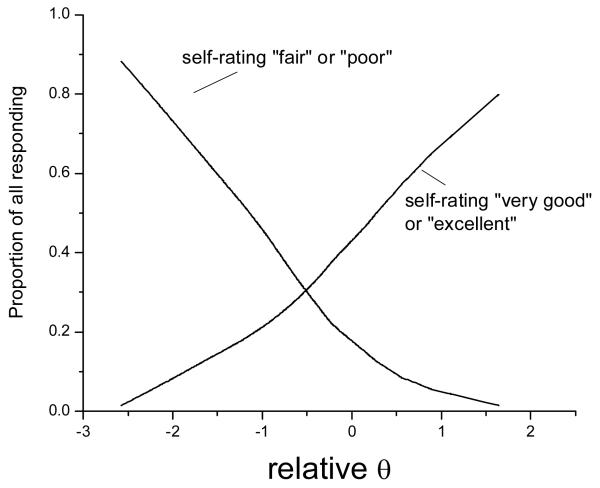
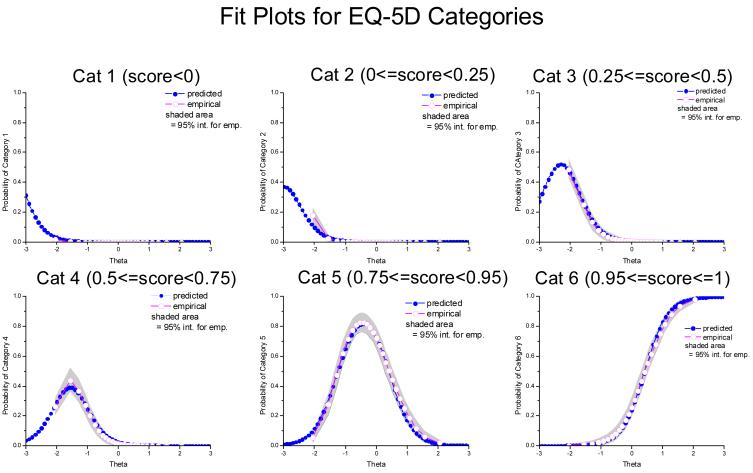
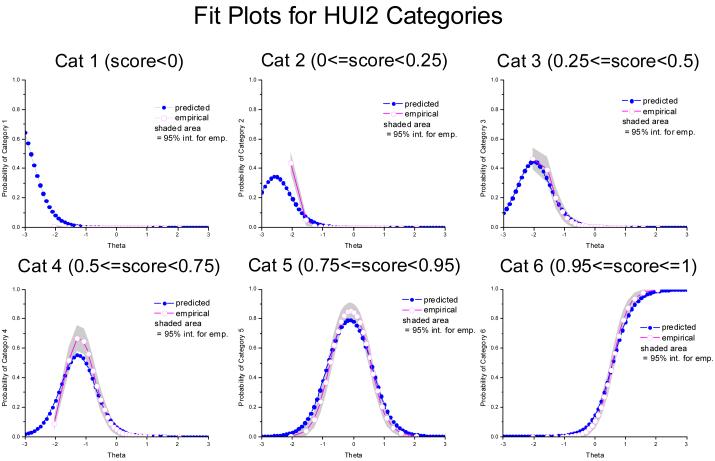
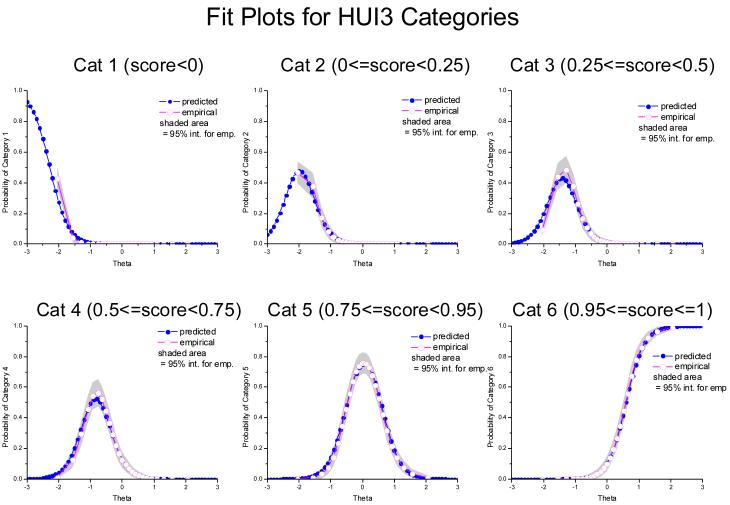
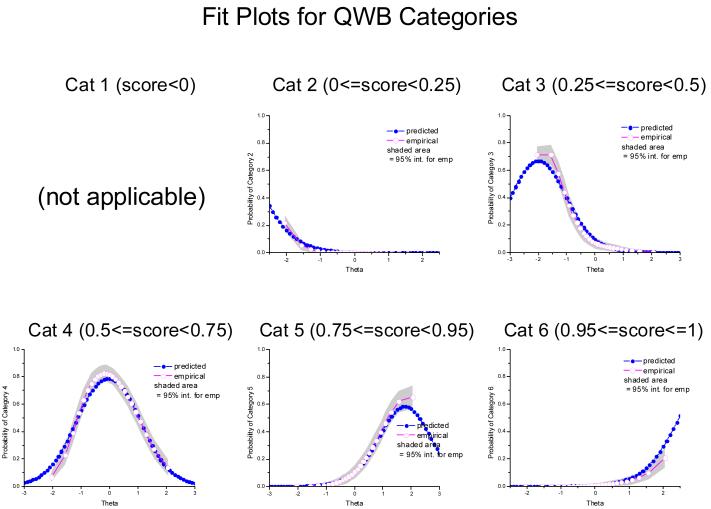
Methods: Data were from the National Health Measurement Study, a telephone survey of 3844 US adults. The 5 indexes were analyzed using item response theory analysis to estimate scores on an underlying construct of summary health, theta. Unidimensionality was evaluated using nonlinear principal components analysis. Index scores were plotted against the estimated scores on the common underlying construct. In addition, scores on the Health and Activities Limitation Index (HALex), the Centers for Disease Control and Prevention Healthy Days questions, and self-rated health on a 5-category scale ranging from excellent to poor were plotted.

Results: SF-6D and QWB-SA are nearly linear across the range of but with a shallow slope; EQ-5D, HUI2, and HUI3 are linear with a steep slope from low (poor health) into midrange of , then approximately linear with a less steep slope for higher (health just below to well above average), although the inflection points differ by index.

Conclusion: Simple linear functions may serve as crosswalks among these indexes only for lower health states, albeit with low precision. Ceiling effects make crosswalks among most of the indexes ill specified above a certain level of health. Although each index measures generic health on a utility scale, these indexes are not identical but are relatively simply, if imprecisely, related.


Figures

Figure 1
Figure 1
Histogram of item response theory (IRT)-calculated latent summary health scores (θ) for 3844 individuals.
Figure 2
Figure 2
The 6 panels plot index scores v. θ for the 5 main health-related quality-of-life (HRQoL) indexes and the Health Activities Limitations Index (HALex). Horizontal and vertical banding for the 3844 data points in each plot represents discrete attainable levels for the index or derived θs. The heavy lines are points fit using Minitab®15.1 statistical software and the locally weighted scatterplot smoothing (LOWESS) option, a variant of kernel smoothing in the vertical dimension of scatterplots.[16] The LOWESS lines demonstrate nonlinearity of the relation between the index scales and θ.
Figure 3
Figure 3
Scatterplots of “Healthy Days” questions v. θ. These questions ask respondents how many days out of the past 30 their physical health and mental health was “not good.” The third question (H-Days all) asks out of the past 30 days how many days did poor physical or mental health keep the respondent from doing usual activities such as self-care, work, or recreation. The heavy lines are LOWESS smoothed lines as in Figure 2. Each scatterplot displays 3844 data points (gray circles).
Figure 4
Figure 4
Smoothed proportions of National Health Measurement Study (NHMS) respondents self-rating health as “fair” or “poor” and as “very good” or “excellent” as a function of θ. The proportions of responses in these categories were calculated for a window of 50 data points moving from θ=–2.5 through θ=2 for the 3844 observations. The resulting proportions were then Locally Weighted Scatterplot Smoothing (LOWESS)- smoothed as described for Figure 2 and the result shown here.
Figure A2–1
Figure A2–1
Histogram of IRT-calculated latent summary health scores (Relative θ) for 3844 individuals.
Figure A2–2
Figure A2–2
The six panels plot index scores versus Relative θ for the 5 main HRQoL indexes and the HALex. The heavy lines are points fit using Minitab®15.1 statistical software and the locally weighted scatterplot smoother (LOWESS) option.
Figure A2–3
Figure A2–3
Scatterplots of “healthy days” questions versus Relative θ. These questions ask respondents how many days out of the past 30 their physical health, mental health was “not good.” The third question (H-Days all) asks out of the past 30 days how many days did poor physical or mental health keep the respondent from doing usual activities such as self-care, work, or recreation. The heavy lines are LOWESS smoothed lines as in Figure 2. Each scatterplot displays 3844 data points (gray circles).
Figure A2–4
Figure A2–4
Smoothed proportions of NHMS respondents self-rating health as “fair” or “poor” and as “very good” or “excellent” as a function of Relative θ. The proportions of responses in these categories were calculated for window of 50 data points moving from θ=-2.5 through θ=2 for the 3844 observations. The resulting proportions were then LOWESS smoothed as described for Fig. A2–2 and the result shown here.
None
None
None
None
None

References

    1. Houle C, Berthelot J-M. A Head-to-Head Comparison of the Health Utilities Index Mark 3 and the EQ-5D for the Population Living in Private Households in Canada. Quality of Life Newsletter. 2000;24:5–6. MAPI Institute.
    1. Kaplan RM, Groessl EJ, Sengupta N, et al. Comparison of measured utility scores and imputed scores from the SF-36 in patients with rheumatoid arthritis. Med Care. 2005;43:79–87. - PubMed
    1. Luo N, Chew LH, Fong KY, et al. A comparison of the EuroQol-5D and the Health Utilities Index mark 3 in patients with rheumatic disease. J Rheumatol. 2003;30:2268–74. - PubMed
    1. Luo N, Johnson JA, Shaw JW, et al. Self-Reported Health Status of the General Adult US Population as Assessed by the EQ-5D and Health Utilities Index. Med Care. 2005;43:1078–86. - PubMed
    1. Pickard AS, Johnson JA, Feeny DH. Responsiveness of generic health-related quality of life measures in stroke. Qual Life Res. 2005;14:207–19. - PubMed

Publication types