. 2009 Nov;5(8):1118-30.
doi: 10.4161/auto.5.8.9991. Epub 2009 Nov 2.

Targeted deletion of autophagy-related 5 (atg5) impairs adipogenesis in a cellular model and in mice

Affiliations

Targeted deletion of autophagy-related 5 (atg5) impairs adipogenesis in a cellular model and in mice

Rebecca Baerga et al. Autophagy. 2009 Nov.

Abstract

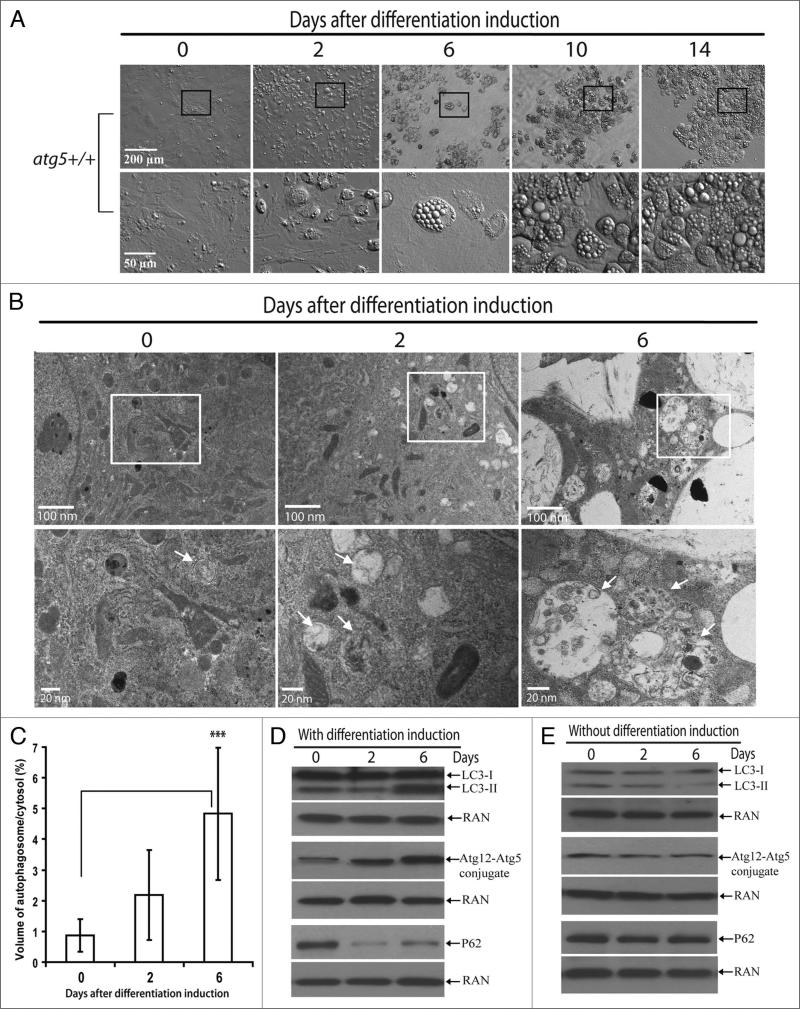
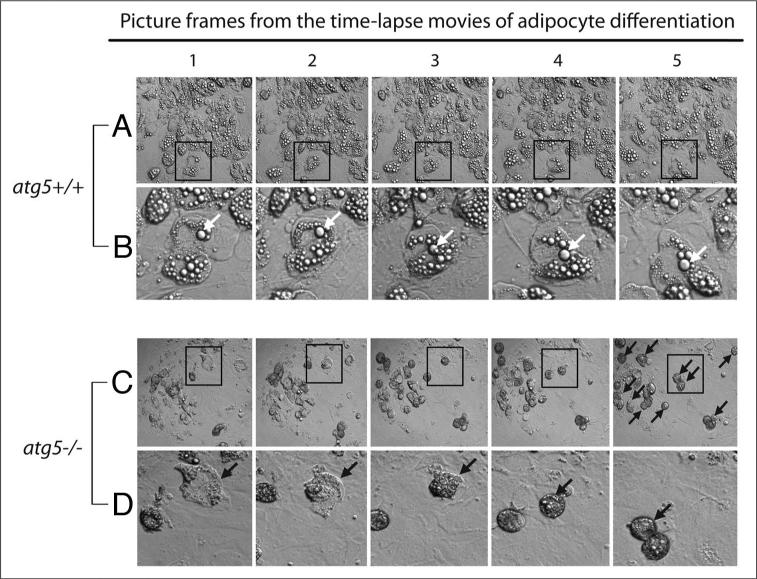
Mammalian white adipocytes have a unique structure in which nearly the entire cell volume is occupied by a single large lipid droplet, while the surrounding cytoplasm occupies minimal space. The massive cytoplasmic remodeling processes involved in the formation of this unique cellular structure are poorly defined. Autophagy is a membrane trafficking process leading to lysosomal degradation of cytoplasmic components. Here, we investigated the functional role of atg5, a gene encoding an essential protein required for autophagy, in adipocyte differentiation in a cellular model and in mice. Massive autophagy was activated when wild-type primary mouse embryonic fibroblasts (MEFs) were induced for adipocyte differentiation. Importantly, the autophagy deficient primary atg5(-/-) MEFs exhibited dramatically reduced efficiency in adipogenesis. Time-lapse microscopy revealed that atg5(-/-) MEFs initially appeared to differentiate normally; however, a majority of the differentiating atg5(-/-) cells ultimately failed to undergo further morphological transformation and eventually died, likely through apoptosis. Consistent with these in vitro results, histological analysis revealed that the atg5(-/-) late-stage embryos and neonatal pups had much less subcutaneous perilipin A-positive adipocytes. Consistently, when treated with chloroquine, a functional inhibitor of autophagy, wild-type MEFs exhibited drastically reduced efficiency of adipocyte differentiation. Taken together, these findings demonstrated that Atg5 is involved in normal adipocyte differentiation, suggesting an important role of autophagy in adipogenesis.


Figures

Figure 1
Figure 1
Autophagy was activated in wild-type MEFs during adipogenesis. (A) Primary atg5+/+ MEFs were induced for adipogenesis. At indicated time points, the progress of differentiation was analyzed. Cells were observed under microscope (Olympus IX70) equipped with relief contrast objectives (10X and 40X, for low and high magnification, respectively). Selected regions in pictures of low magnification (within the squares) are shown below with high magnification. (B) Electron microscopy analysis of primary atg5+/+ MEFs 0, 2 or 6 days after differentiation induction, as indicated. Upper panel shows micrographs of low magnification, and the lower panel shows high magnification of the selected regions (square) in the upper panel. Arrows indicate autophagosomes. (C) Ratio of the volume of autophagosomes to cytosol. The volume of autophagosomes and cytosol were determined by point counting of 15–20 micrographs of cells 0, 2 or 6 days after differentiation induction, as indicated. ***p < 0.001. Student t-test. (D and E). Immunoblotting assays of differentiating cells. The cells at indicated time points with (D) or without (E) differentiation induction were harvested and immunoblotting assays were performed with LC3, Atg12, p62 or RAN antibodies, as indicated. The levels of RAN served as a loading control. The data are representative results from three independent experiments.
Figure 2
Figure 2
Autophagy deficient primary atg5-/- MEFs exhibited reduced efficiency in adipogenesis. Primary atg5+/+ or atg5-/- MEFs were induced for adipogenesis. At indicated time points, the progress of differentiation was analyzed. (A) Cells were observed under microscope (Olympus IX70) equipped with relief contrast objectives (10X and 40X, for low and high magnification, respectively). Selected regions in pictures of low magnification (within the squares) are shown below with high magnification. (B) Cells were stained with the lipid dye Bodipy 493/503 and observed with microscope under phase contrast objectives (20X). (C) 14 days post-differentiation inductions, cells were stained with the lipid dye Oil Red-O and hematoxylin, and observed under phase contrast microscope. (D) Cells grown on cover slip were stained with Oil Red-O at indicated time points and Oil Red-O was extracted and measured by spectrometry. These data represent results from experiments with cells derived from four independent pairs of embryos of three independent breeding parents.
Figure 3
Figure 3
Quantitative PCR analysis of the expression of a subset of adipogenesis marker genes. mRNA were extracted from the atg5+/+ and atg5-/- cells at Day 0 or Day 6 of differentiation and analyzed by quantitative PCR. The graphic representations show relative expression levels of each adipogenesis related gene, as indicated, as compared to the normalizer gene Wbp11NORM. *denote values that were undetectable. Error bars represent one standard deviation.
Figure 4
Figure 4
Time-lapse microscopy analysis of adipogenesis in the atg5+/+ and atg5-/- MEFs. Primary MEFs were treated to induce adipocyte differentiation. Three days after induction, time-lapse microscopy with relief contrast lens was performed to monitor the progression of differentiation. (A–D) are picture frames taken from two-day movie clips (Suppl. Material 1–4, respectively) showing the continuous morphologic changes during differentiation. Areas in square regions of (A and C) are enlarged below to show detail in (B and D), respectively. White arrows in (B) point to a growing lipid droplet; and black arrows in (C), and (D) point to cells undergoing abortive differentiation. The data represent results from experiments performed with three independent pairs of MEFs.
Figure 5
Figure 5
Differentiating atg5-/- MEFs exhibited higher rates of apoptosis. (A) Primary atg5+/+ or atg5-/- MEFs were induced for adipogenesis. The progress of differentiation and apoptotic cell death was analyzed with Bodipy 493/503 staining (green), DAPI staining (blue) and TUNEL assay (red), respectively. The pictures showed cells at Day 6 post-differentiation induction. Representative low (with a scale bar of 50 μm) and higher (with a scale bar of 10 μm) magnification pictures are shown. (B) Quantification of the TUNEL positive cells as a percentage of Bodipy 493/503 positive cells at the indicated time points. Total number of Bodipy 493/503 positive cells and total number of both TUNEL positive cells and Bodipy 493/503 positive cells in randomly selected regions were counted and the percentage was calculated. The data are representative results from three independent experiments. **p < 0.01; Student t-test.
Figure 6
Figure 6
The atg5-/- mice had fewer subcutaneous fat cells. atg5-/- embryos (E18.5) and neonatal pups (within 12 hours after birth) and their wild-type littermates were obtained and the transverse sections at the level of scapulae were analyzed by immunofluorescence microscopy with primary antibody against perilipin A and FITC-conjugated secondary antibody. (A) Subcutaneous regions of embryos showing perilipin A positive adipocytes. (B) Subcutaneous regions of neonatal pups showing perilipin A positive adipocytes. (C) quantification of (A). Total number of perilipin A positive cells in subcutaneous regions of three adjacent scapulae sections were counted and averaged. (D) quantification of (B). Total number of perilipin A positive cells in subcutaneous regions of three adjacent scapulae sections were counted and averaged. The data are representative results from three independent pairs of pups born to two independent pairs of parents and three pairs of embryos born to three pairs of parents. **p < 0.01; ***p < 0.001. Student t-test.
Figure 7
Figure 7
Chloroquine significantly reduced the efficiency of adipogenesis in primary MEFs. Wild-type primary MEFs were induced for adipogenesis with or without co-treatment of 10 μM chloroquine (CQ). Differentiation progress was then monitored by: (A) microscopy analysis; (B) lipid analysis with Bodipy 493/503 staining (14 days after differentiation induction); (C) lipid analysis by spectrometry of Oil Red-O staining (14 days after differentiation induction). (D and E) are controls that show that chloroquine was nontoxic (D) and efficacious in inhibiting autophagosome fusion with lysosome and in inhibiting autophagy flux (E) at the experimental concentration. (D) Tunel assays of wild-type MEFs treated with 10 μM chloroquine for 4 days compared with cells without chloroquine treatment. Cells treated with 10 μM staurosporine (STS) for 6 hr was used as a positive control. (E) Cells treated with/or without 10 μM chloroquine at different time points were harvested, immunoblotting assays were performed with LC3, p62 or RAN antibodies, as indicated. The levels of RAN served as a loading control. The results represent three independent experiments. *p < 0.05; Student t-test.

References

    1. Rosen ED, Spiegelman BM. Adipocytes as regulators of energy balance and glucose homeostasis. Nature. 2006;444:847–53. - PMC - PubMed
    1. Cannon B, Nedergaard J. Brown adipose tissue: function and physiological significance. Physiol Rev. 2004;84:277–359. - PubMed
    1. Farmer SR. Transcriptional control of adipocyte formation. Cell Metab. 2006;4:263–73. - PMC - PubMed
    1. Hansen JB, Kristiansen K. Regulatory circuits controlling white versus brown adipocyte differentiation. Biochem J. 2006;398:153–68. - PMC - PubMed
    1. Rosen ED, MacDougald OA. Adipocyte differentiation from the inside out. Nat Rev Mol Cell Biol. 2006;7:885–96. - PubMed

Publication types

MeSH terms

LinkOut - more resources