Review
. 2009 Nov;6(11 Suppl):S22-32.
doi: 10.1038/nmeth.1371.

Computation for ChIP-seq and RNA-seq studies

Affiliations
Review

Computation for ChIP-seq and RNA-seq studies

Shirley Pepke et al. Nat Methods. 2009 Nov.

Abstract

Genome-wide measurements of protein-DNA interactions and transcriptomes are increasingly done by deep DNA sequencing methods (ChIP-seq and RNA-seq). The power and richness of these counting-based measurements comes at the cost of routinely handling tens to hundreds of millions of reads. Whereas early adopters necessarily developed their own custom computer code to analyze the first ChIP-seq and RNA-seq datasets, a new generation of more sophisticated algorithms and software tools are emerging to assist in the analysis phase of these projects. Here we describe the multilayered analyses of ChIP-seq and RNA-seq datasets, discuss the software packages currently available to perform tasks at each layer and describe some upcoming challenges and features for future analysis tools. We also discuss how software choices and uses are affected by specific aspects of the underlying biology and data structure, including genome size, positional clustering of transcription factor binding sites, transcript discovery and expression quantification.


Figures

Figure 1
Figure 1. A hierachical overview of ChIP-seq and RNA-seq analyses
The bottom-up analysis of ChIP-seq and RNA-seq data typically involves the use of several software packages whose output serves as the input of the higher level analyses, with the subsections covered by this review circled in red. Apart from de novo transcript assembly for organisms without a reference genome, all sequence-counting packages build upon the output of read mappers onto a reference sequence, which serves as the input of programs that aggregate and identify these reads into enriched regions, density of known exons; many of these programs will further try to identify the sources (ChIP-seq) or novel RNA-seq transcribed fragments (transfrags). These regions and sources can then be analyzed to identify motifs, genes, or expression levels that are typically considered the biologically relevant output of these analyses. As the amount of RNA-seq and ChIP-seq data rapidly accumulates, the need for packages supporting integrative analyses is becoming increasingly pressing.
Figure 2
Figure 2. ChIP-seq Peak Types From Various Experiments and Peak Calling
Data shown in (a-c) are from remapping of a previously published human ChIP-seq dataset. (a) Proteins that bind DNA in a site-specific fashion such as CTCF form narrow peaks 100’s bp wide. The difference of plus and minus read counts is generally expected to cross zero near the signal source, the source in this example being the CTCF motif indicated in red. (b) Signal from enzymes such as RNA Polymerase II may show enrichment over regions up to a few kb in length. (c) Experiments that probe larger scale chromatin structure such as the repressive mark for H3K27me3 may yield very broad “above”-background regions spanning several 100 kb’s.
Figure 3
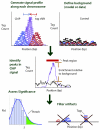
Figure 3. ChIP-seq Peak Calling sub-tasks
Sequence reads are first aligned to the genome. A signal profile that takes on a value at each bp is formed via a census algorithm, e.g. counting the number of reads overlapping each base pair along the genome (upper left plot). In the figure, blue represents ‘+’ strand reads, red represents ‘−‘ strand reads, and purple shows the combined distribution after shifting the ‘+’ and ‘−‘ reads toward the center by the read shift value. Further processing is sometimes performed prior to evaluating the signal (strand-specific tag shifting or smoothing for example). If experimental control data is available (brown), the same processing steps are applied to it to form a background profile (upper right plot); otherwise, a random genomic background may be assumed. The signal and background profiles are compared in order to define regions of enrichment. Finally, peaks are filtered to reduce false positives and ranked according to relative strength or statistical significance. In the lower left figure, P(s) refers to the probability of observing a location with s reads covering it. The bars represent the control data distribution. A hypothetical Poisson distribution fit is shown with sthresh indicating a cutoff above which a ChIP-seq peak might be considered significant. The lower right is a schematic representation of two types of artifactual peaks that may be filtered separately: single strand peaks and peaks formed by multiple occurrences of only one or a few reads.
Figure 4
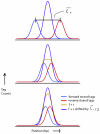
Figure 4. The impact of Fragment Length and Complex Peak Structures in ChIP-seq
(a) The average DNA fragment length can affect resolution with respect to binding site determination. A ChIP-seq experiment yields distributions for tags sequenced from the forward and reverse strands, the maxima of which should be separated by the average fragment length. In real experimental data, an overlap of the two distributions is often observed. If the average fragment length is much longer than the width of the strand distributions, the binding site will fall in between the two distributions. Tag locations are shifted toward the middle will result in a single summit (top illustration). Intermediate fragment lengths yield a single broadened peak in the unshifted aggregate distribution, and tag shifting may improve resolution a small amount by more precisely locating the summit (middle illustration). Very short fragments, such that the strand-specific densities are separated by a distance significantly less than the width of the individual distributions, can yield good binding site resolution without tag shifting tag. (b) Overlapping tag distributions are observed for clusters of nearby peaks such as the pictured double for a CTCF peak region in human. Motif mapping reveals two CTCF binding sites (in red), though ChIP-seq signal suggests a single binding site call lying between the two motifs. As an example, the ERANGE region call (orange) is shown to cover both motifs. The problem of reliably discriminating multiple binding sites with very closely overlapping signals is an ongoing area of research.
Figure 5
Figure 5. Overview of RNA-seq
A RNA fraction of interest is selected, fragmented, and reverse transcribed. The resulting cDNA can then be sequenced using any of the current ultra-high-throughput technologies to obtain ten to a hundred million reads, which are then mapped back onto the genome. The reads are then analyzed to calculate expression levels.
Figure 6
Figure 6. Approaches to handling of spliced reads
(a) In de novo transcriptome assembly, splice-crossing reads (red) are no different than any other reads, but will only contribute to a contig (solid green), when the reads are at high enough density to overlap by more than a set of user-defined assembly parameters. Parts of gene models (dotted green) or entire gene models (dotted magenta) can be missed if expressed at sub-threshold. (b) Splice crossing reads can be mapped directly onto the genome if the reads are long enough to make gapped-read mappers practical. (c) Alternatively, regular short read mappers can be used to map spliced reads ungapped onto supplied additional known or predicted splice junctions.

References

    1. ENCODE Project Consortium Identification and analysis of functional elements in 1% of the human genome by the ENCODE pilot project. Nature. 2007;447(7146):799–816. - PMC - PubMed
    1. Wold B, Myers RM. Sequence census methods for functional genomics. Nat Methods. 2008;5(1):19–21. - PubMed
    1. Trapnell C, Salzberg SL. How to map billions of short reads onto genomes. Nat Biotechnol. 2009;27(5):455–7. - PMC - PubMed
    1. Johnson DS, Mortazavi A, Myers RM, Wold B. Genome-wide Mapping of in Vivo Protein-DNA Interactions. Science. 2007;316:1497–1502. - PubMed
    1. Rozowsky J, Euskirchen G, Auerbach RK, Zhang ZD, Gibson T, Bjornson R, Carriero N, Snyder M, Gerstein MB. PeakSeq enables systematic scoring of ChIP-seq experiments relative to controls. Nature Biotechnology. 2009;27(1):66–75. - PMC - PubMed

Publication types