

A statistical model of protein sequence similarity and function similarity reveals overly-specific function predictions
- PMID: 19844580
- PMCID: PMC2760442
- DOI: 10.1371/journal.pone.0007546
A statistical model of protein sequence similarity and function similarity reveals overly-specific function predictions
Abstract
Background: Predicting protein function from primary sequence is an important open problem in modern biology. Not only are there many thousands of proteins of unknown function, current approaches for predicting function must be improved upon. One problem in particular is overly-specific function predictions which we address here with a new statistical model of the relationship between protein sequence similarity and protein function similarity.
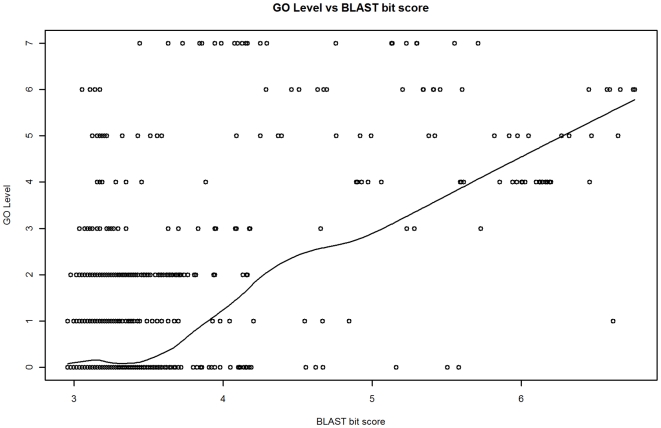
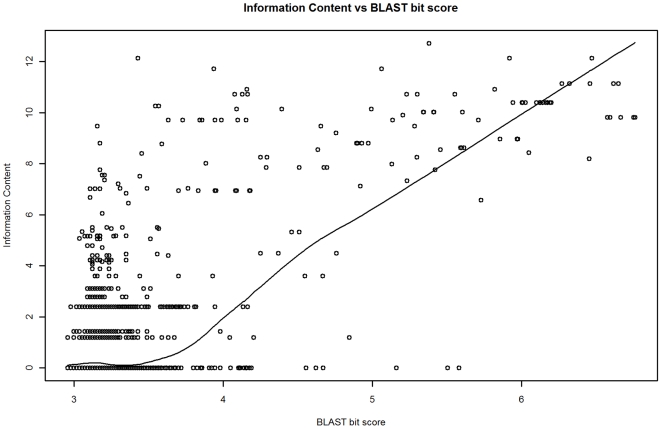
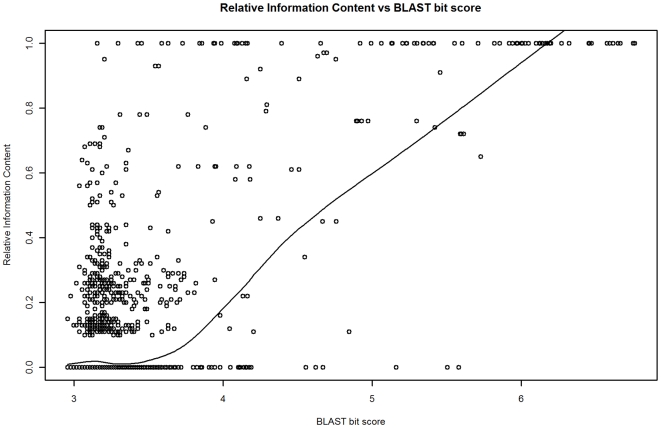
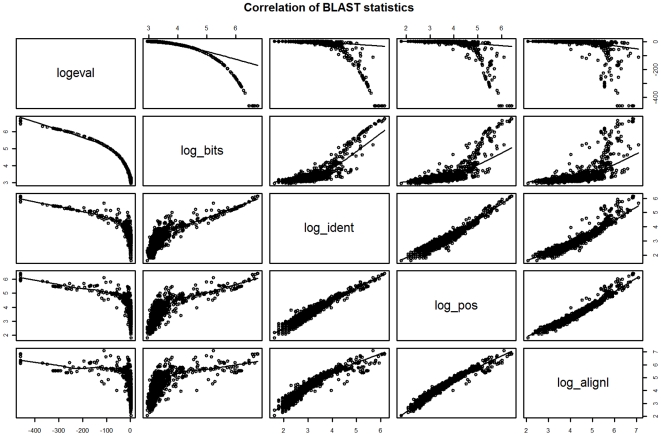
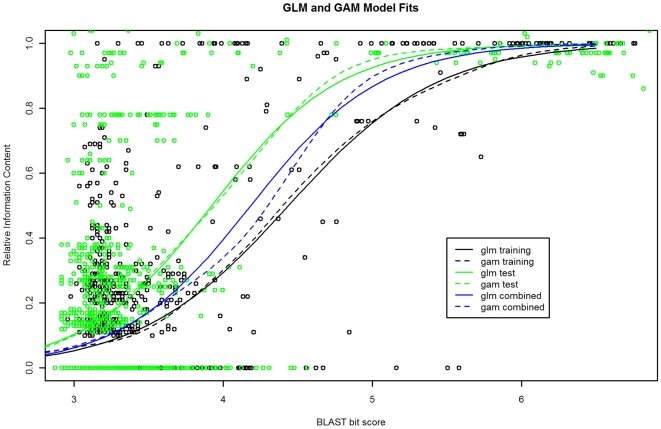
Methodology: Our statistical model is based on sets of proteins with experimentally validated functions and numeric measures of function specificity and function similarity derived from the Gene Ontology. The model predicts the similarity of function between two proteins given their amino acid sequence similarity measured by statistics from the BLAST sequence alignment algorithm. A novel aspect of our model is that it predicts the degree of function similarity shared between two proteins over a continuous range of sequence similarity, facilitating prediction of function with an appropriate level of specificity.
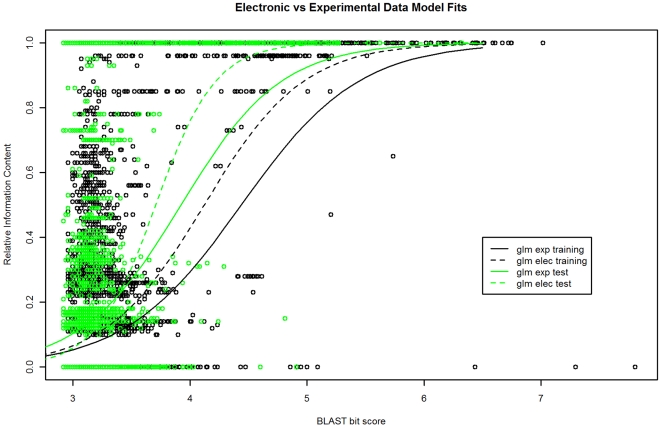
Significance: Our model shows nearly exact function similarity for proteins with high sequence similarity (bit score >244.7, e-value >1e(-62), non-redundant NCBI protein database (NRDB)) and only small likelihood of specific function match for proteins with low sequence similarity (bit score <54.6, e-value <1e(-05), NRDB). For sequence similarity ranges in between our annotation model shows an increasing relationship between function similarity and sequence similarity, but with considerable variability. We applied the model to a large set of proteins of unknown function, and predicted functions for thousands of these proteins ranging from general to very specific. We also applied the model to a data set of proteins with previously assigned, specific functions that were electronically based. We show that, on average, these prior function predictions are more specific (quite possibly overly-specific) compared to predictions from our model that is based on proteins with experimentally determined function.
Conflict of interest statement
Figures
References
-
- Galperin MY, Koonin EV. Sources of systematic error in functional annotation of genomes: domain rearrangement, non-orthologous gene displacement and operon disruption. In Silico Biol. (Gedrukt) 1998;1:55–67. - PubMed
-
- Karp PD. What we do not know about sequence analysis and sequence databases. Bioinformatics. 1998;14:753–754. - PubMed
-
- Brenner SE. Errors in genome annotation. Trends in Genetics. 1999;15:132–133. doi: 10.1016/S0168-9525(99)01706-0. - DOI - PubMed
-
- Thomas GH. Completing the E. coli proteome: a database of gene products characterised since the completion of the genome sequence. Bioinformatics. 1999;15:860–861. - PubMed
-
- Bork P. Powers and pitfalls in sequence analysis: the 70% hurdle. Genome Res. 2000;10:398–400. - PubMed
Publication types
MeSH terms
Substances
Grants and funding
LinkOut - more resources
Full Text Sources
Research Materials
