

Metabolic profiling reveals key metabolic features of renal cell carcinoma
- PMID: 19845817
- PMCID: PMC3822498
- DOI: 10.1111/j.1582-4934.2009.00939.x
Metabolic profiling reveals key metabolic features of renal cell carcinoma
Abstract
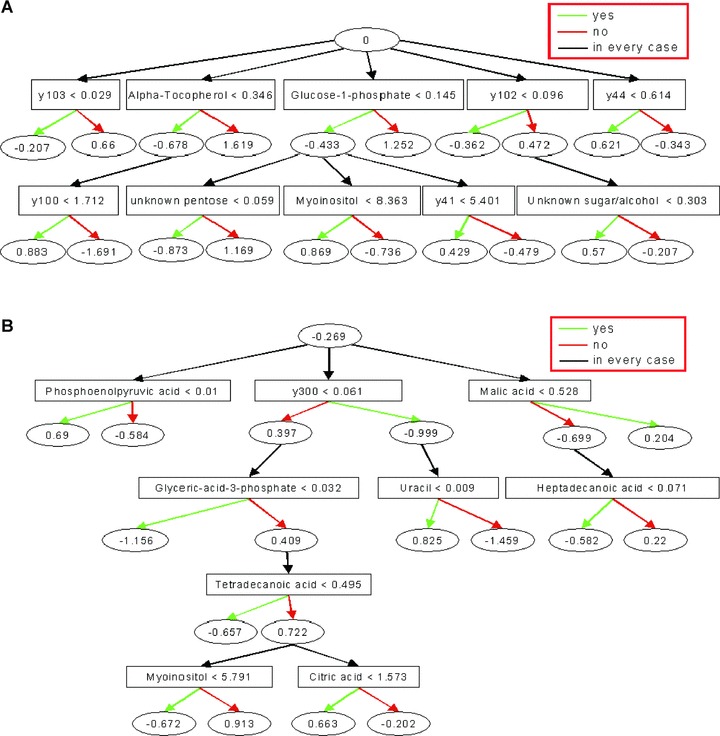
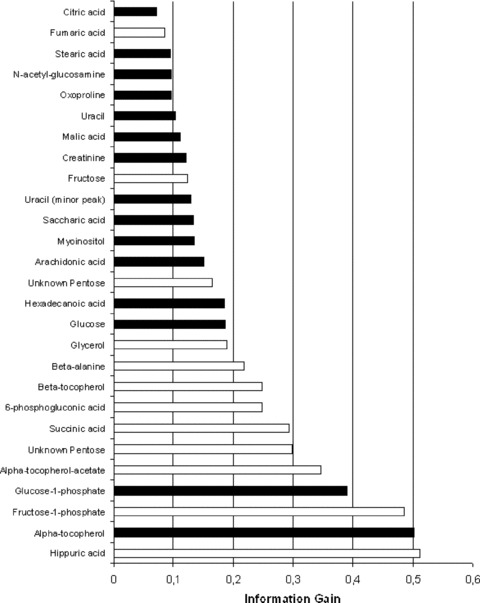
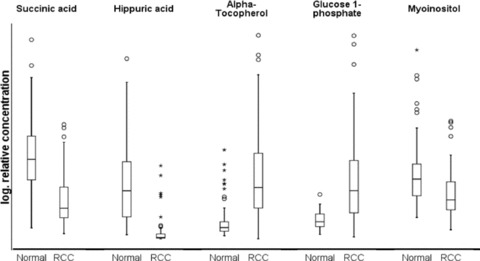
Recent evidence suggests that metabolic changes play a pivotal role in the biology of cancer and in particular renal cell carcinoma (RCC). Here, a global metabolite profiling approach was applied to characterize the metabolite pool of RCC and normal renal tissue. Advanced decision tree models were applied to characterize the metabolic signature of RCC and to explore features of metastasized tumours. The findings were validated in a second independent dataset. Vitamin E derivates and metabolites of glucose, fatty acid, and inositol phosphate metabolism determined the metabolic profile of RCC. α-tocopherol, hippuric acid, myoinositol, fructose-1-phosphate and glucose-1-phosphate contributed most to the tumour/normal discrimination and all showed pronounced concentration changes in RCC. The identified metabolic profile was characterized by a low recognition error of only 5% for tumour versus normal samples. Data on metastasized tumours suggested a key role for metabolic pathways involving arachidonic acid, free fatty acids, proline, uracil and the tricarboxylic acid cycle. These results illustrate the potential of mass spectroscopy based metabolomics in conjunction with sophisticated data analysis methods to uncover the metabolic phenotype of cancer. Differentially regulated metabolites, such as vitamin E compounds, hippuric acid and myoinositol, provide leads for the characterization of novel pathways in RCC.
© 2011 The Author Journal of Cellular and Molecular Medicine © 2011 Foundation for Cellular and Molecular Medicine/Blackwell Publishing Ltd.
Figures
References
-
- Gillies RJ, Gatenby RA. Hypoxia and adaptive landscapes in the evolution of carcinogenesis. Cancer Metastasis Rev. 2007;26:311–7. - PubMed
-
- Pelicano H, Martin DS, Xu RH, et al. Glycolysis inhibition for anticancer treatment. Oncogene. 2006;25:4633–46. - PubMed
-
- Denkert C, Budczies J, Kind T, et al. Mass spectrometry-based metabolic profiling reveals different metabolite patterns in invasive ovarian carcinomas and ovarian borderline tumors. Cancer Res. 2006;66:10795–804. - PubMed
-
- Fiehn O, Kind T. Metabolite profiling in blood plasma. Methods Mol Biol. 2007;358:3–17. - PubMed
MeSH terms
Substances
LinkOut - more resources
Full Text Sources
Other Literature Sources
Medical
