Comparative Study
. 2010 Jan;112(1):227-37.
doi: 10.1111/j.1471-4159.2009.06445.x. Epub 2009 Oct 21.

Disease-toxicant screen reveals a neuroprotective interaction between Huntington's disease and manganese exposure

Affiliations
Comparative Study

Disease-toxicant screen reveals a neuroprotective interaction between Huntington's disease and manganese exposure

B Blairanne Williams et al. J Neurochem. 2010 Jan.

Abstract

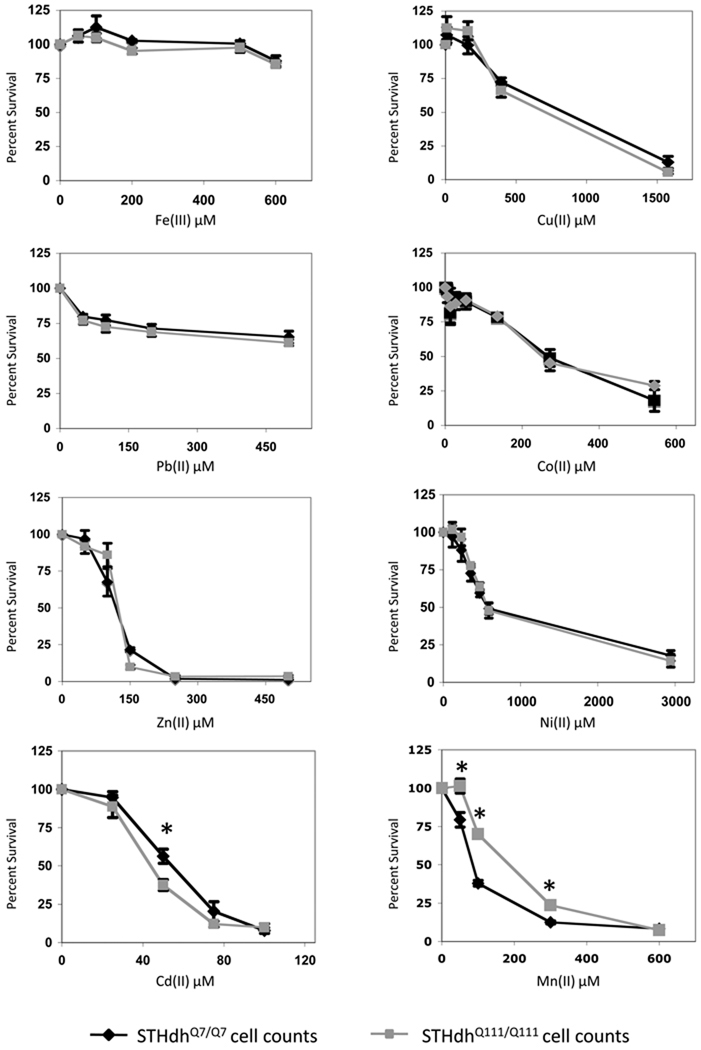
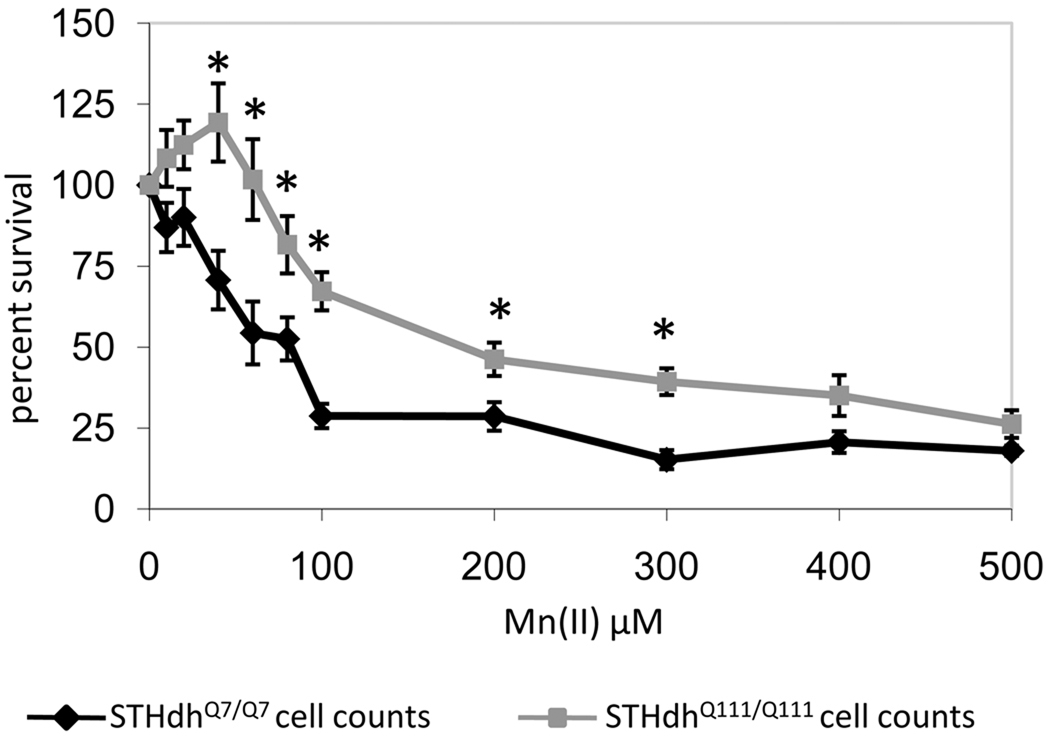
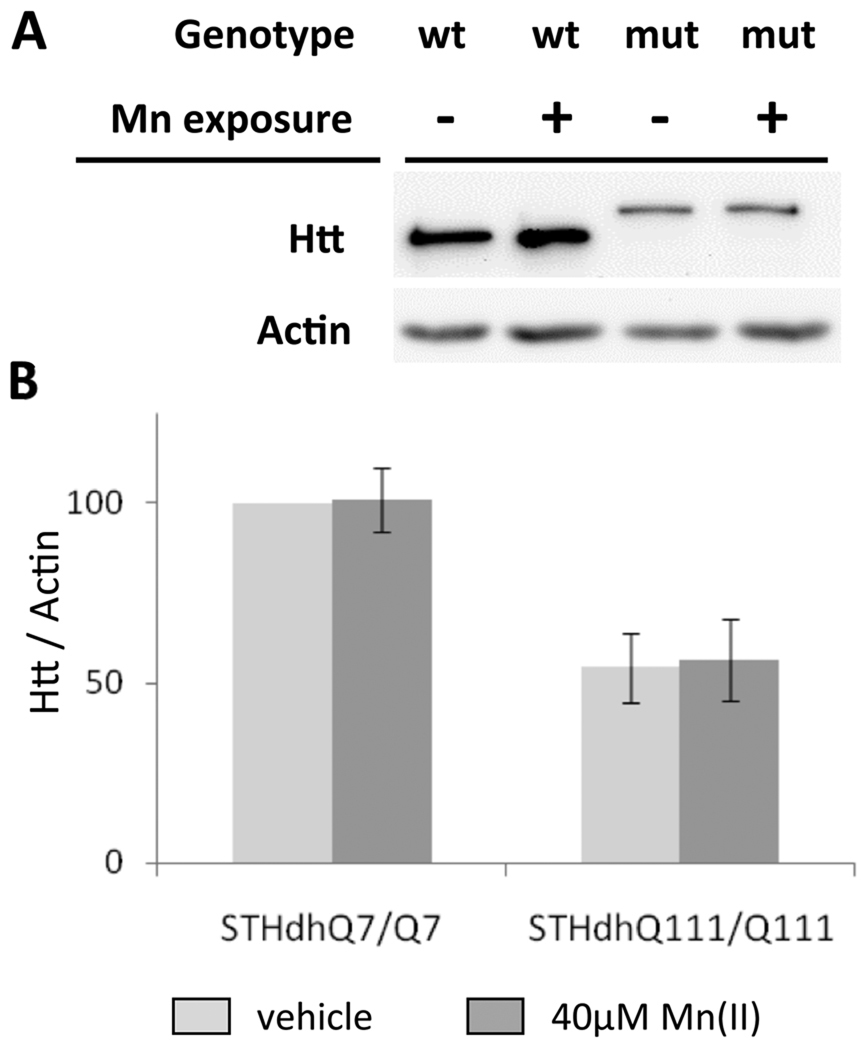
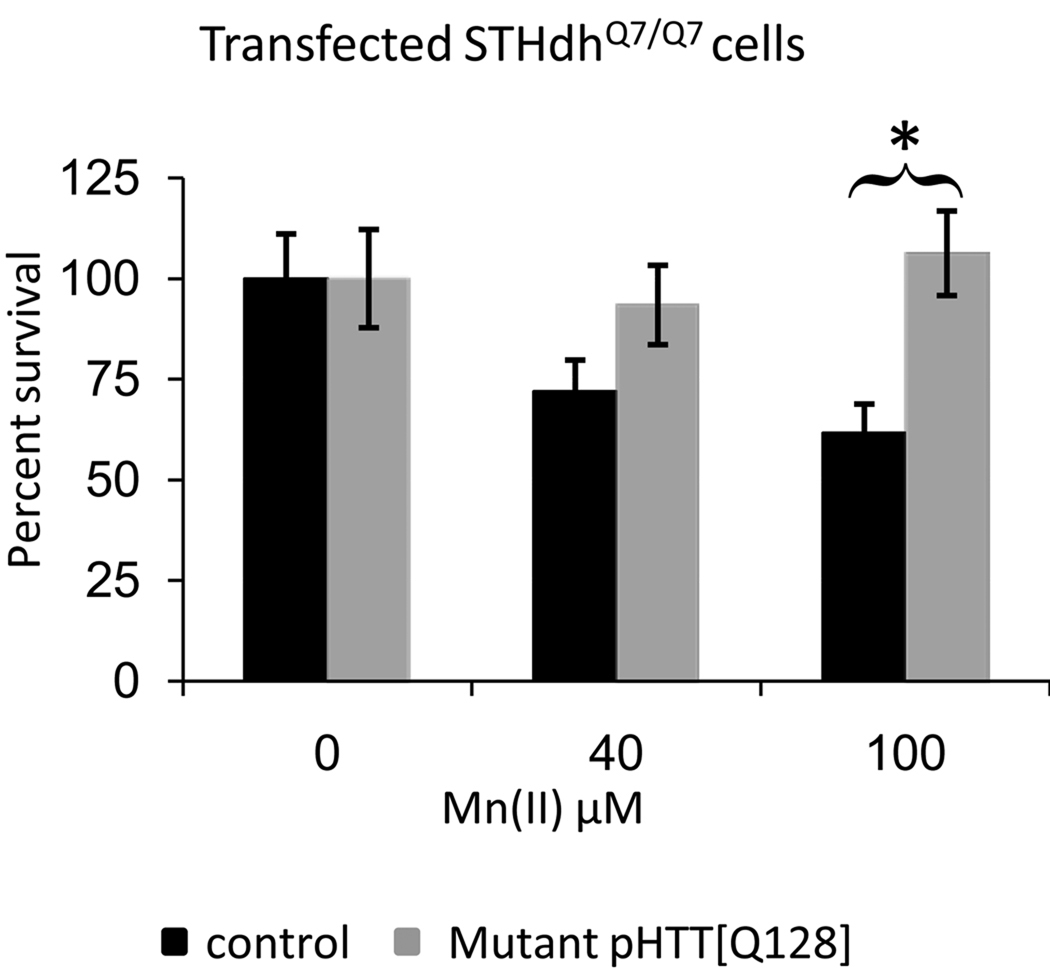
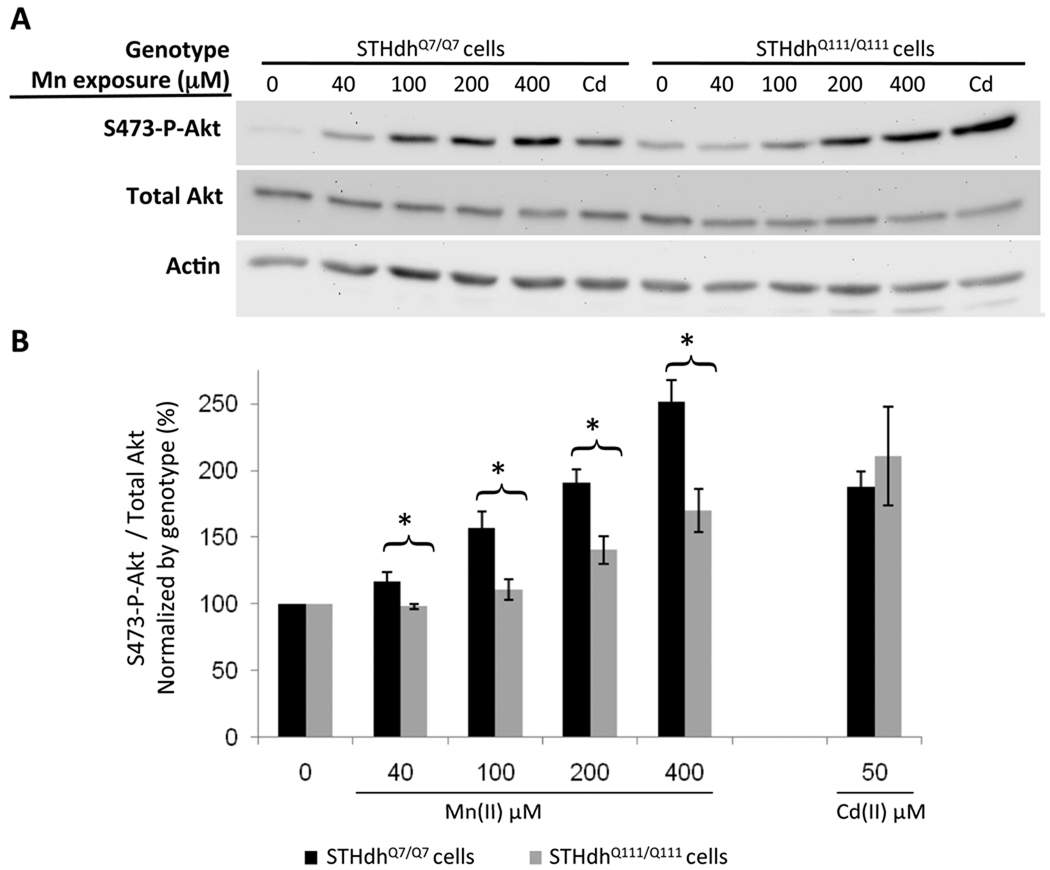
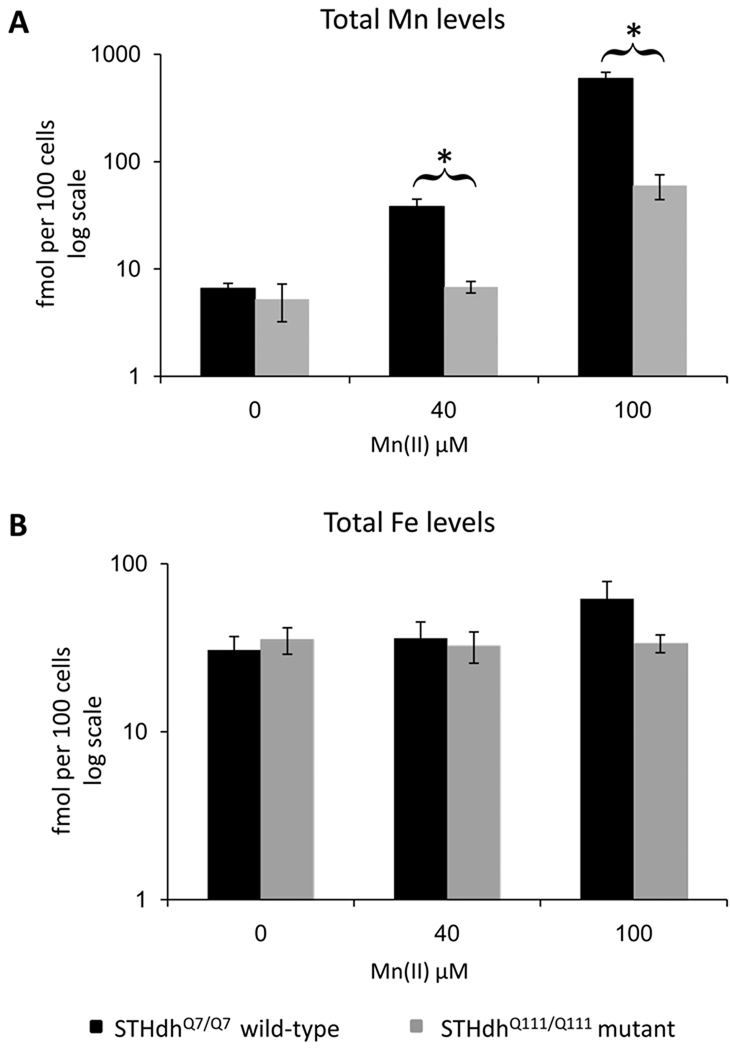
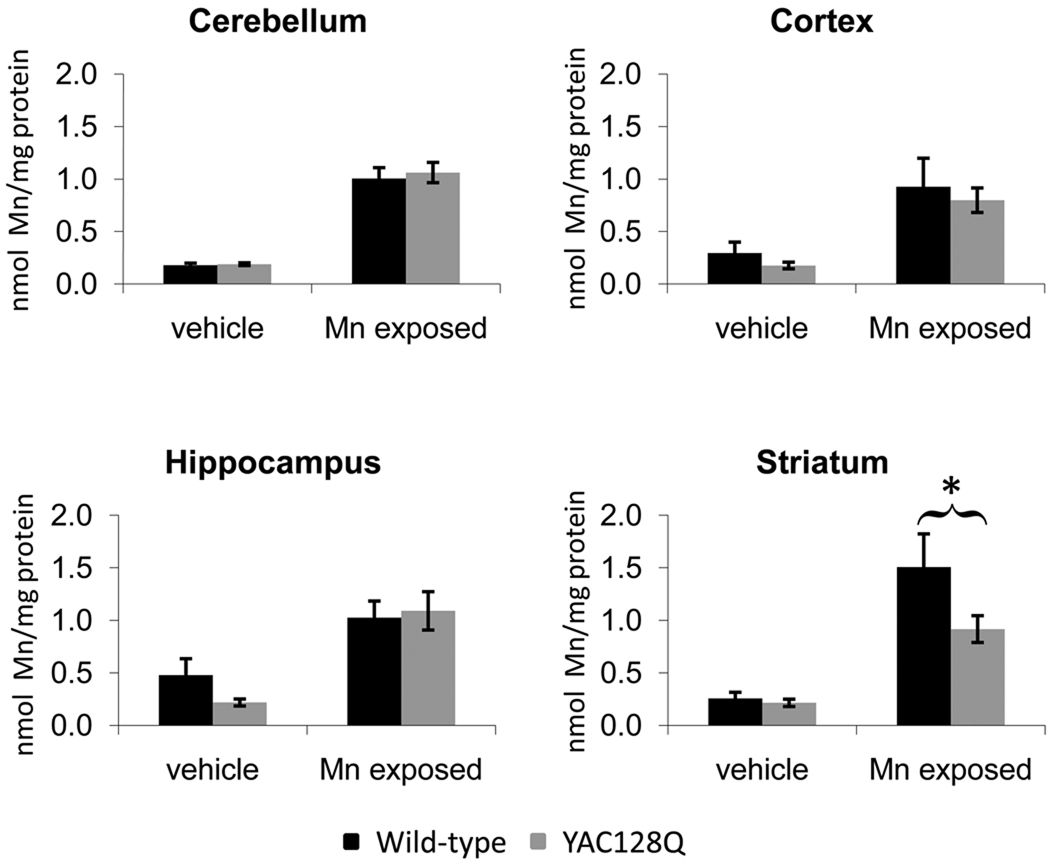
Recognizing the similarities between Huntington's disease (HD) pathophysiology and the neurotoxicology of various metals, we hypothesized that they may exhibit disease-toxicant interactions revealing cellular pathways underlying neurodegeneration. Here, we utilize metals and the STHdh mouse striatal cell line model of HD to perform a gene-environment interaction screen. We report that striatal cells expressing mutant Huntingtin exhibit elevated sensitivity to cadmium toxicity and resistance to manganese toxicity. This neuroprotective gene-environment interaction with manganese is highly specific, as it does not occur with iron, copper, zinc, cobalt, cadmium, lead, or nickel ions. Analysis of the Akt cell stress signaling pathway showed diminished activation with manganese exposure and elevated activation after cadmium exposure in the mutant cells. Direct examination of intracellular manganese levels found that mutant cells have a significant impairment in manganese accumulation. Furthermore, YAC128Q mice, a HD model, showed decreased total striatal manganese levels following manganese exposure relative to wild-type mice. Thus, this disease-toxicant interaction screen has revealed that expression of mutant Huntingtin results in heightened sensitivity to cadmium neurotoxicity and a selective impairment of manganese accumulation.


Figures

Fig. 1
Fig. 1
Huntington’s disease - metal toxicity cell survival screen. Equal numbers of wild-type STHdhQ7/Q7 (black) or mutant STHdhQ111/Q111(grey) cells were exposed to the indicated metal ions. Cell survival was assessed 26–30 hours after exposure by MTT assay for all metals except Cu, which was assessed by trypan blue exclusion. The average absorbance (or mean cell counts for Cu) relative to the untreated control for each genotype is plotted as percent cell survival (± SEM), with Cu(II) chloride (4 experiments), Fe(III) chloride (3 experiments), Cd(II) chloride (4 experiments), Zn(II) chloride (3 experiments), Pb(II) chloride (3 experiments), Co(II) chloride (4 experiments), Ni(II) chloride (3 experiments) and Mn(II) chloride (2 experiments). Each experiment had between 3 and 6 independent samples at each genotype/metal concentration point. ANOVA showed a significant effect of exposure on cell survival for all metals (p<0.001), and finds a significant difference in cell survival between genotypes only for Cd(II) (p=0.029) and Mn(II) (p=0.001). Significant differences in survival (* p<0.05 post-hoc t-test) between wild-type and mutant cells at specific exposure levels are shown.
Fig. 2
Fig. 2
Mutant HD striatal cells are resistant to Mn(II) cytotoxicity. Equal numbers of wild-type STHdhQ7/Q7 (black) or mutant STHdhQ111/Q111 (grey) cells were exposed to increasing concentrations of manganese chloride. Cell survival was assessed 30 hours after exposure by trypan blue exclusion assay. The percent of viable cells relative to the untreated control is shown (± SEM. n=3 independent experiments). Significant differences in survival (* p<0.05 post-hoc t-test) between wild-type and mutant cells are shown.
Fig. 3
Fig. 3
Mn(II) exposure does not alter htt protein levels in striatal cells. (A) representative blot showing lysates from STHdhQ7/Q7 (wt) or STHdhQ111/Q111(mut) cells after 30 hours of 40µM Mn(II) chloride exposure (+) were analyzed by western blot. The htt protein from mutant animals runs at a higher molecular weight due to the glutamine-tract expansion. (B) Quantification of htt protein expression in striatal cell lines relative to actin. Mean values are plotted as a percentage of the vehicle exposed wild-type cells (± SEM. n=7 independent samples). Statistical analysis of htt protein levels by two-way univariate ANOVA found a significant effect of genotype (F(1,28)=28.1, p<0.001), but indicated no significant effect of Mn(II) exposure (F(1,28)=1.13, p=0.298) or a genotype by exposure interaction (F(1,28)=1.16, p=0.292). Significant differences in htt protein levels between genotypes were detected for both vehicle and Mn(II) exposed cells (p<0.05 post-hoc t-test).
Fig. 4
Fig. 4
Expression of mutant HTT confers Mn-resistance phenotype. The vectors pHTT[128Q] and pEGFP-N1 were transiently expressed in the STHdhQ7/Q7 cell line and compared to a control vector plus pEGFP-N1 transfection. Following exposure to Mn(II) chloride for 30 hours, cells were stained with DAPI then analyzed by fluorescence microscopy. The number of surviving cells per visual field (18 images per transfection/exposure group, 9 images from 2 independent coverslips) was counted by automated image analysis using NIH ImageJ software. Mean values are plotted as the percentage of cells relative to the average number of cells (± SEM) in vehicle exposed controls for each transfection condition, n=18 images. Significant differences in survival (* p<0.05 post-hoc t-test) between HTT[128Q] expressing and control cells are indicated.
Fig. 5
Fig. 5
Diminished manganese-dependent Akt phosphorylation in HD striatal cells. (A) Lysates harvested from STHdhQ7/Q7 (wild-type) or STHdhQ111/Q111 (mutant) cells after 3 hours of manganese chloride exposure were analyzed by western blot for phosphorylated Akt (S473-P-Akt), total Akt and actin. Representative blots are shown. (B) Quantification of S473-P-Akt/total Akt expression in striatal cell lines. Mean values were normalized by genotype to the vehicle-only control (± SEM, n=4 independent samples). Significant differences in protein levels (* p<0.05 post-hoc t-test) between genotypes are indicated for each exposure.
Fig. 6
Fig. 6
Substantial decrease in manganese accumulation in HD striatal cells. Measurement of total intracellular manganese in (black) STHdhQ7/Q7 or (grey) STHdhQ111/Q111 cell lines after application of indicated concentrations of Mn(II) chloride for 30 hours. (A) The average amount of intracellular manganese is plotted on log scale (± SEM, n=5 independent samples). (B) Measurement of total intracellular iron levels after application of Mn(II) chloride for 30 hours. The average amount of intracellular iron is plotted on log scale (± SEM, n=5 independent samples). Significant differences in metal levels (* p<0.05 post-hoc t-test) between wild-type and mutant STHdh cells for each exposure are indicated.
Fig. 7
Fig. 7
Reduced striatal manganese uptake in the YAC128Q HD mouse model. Wild-type and YAC128Q HD mice at 3 months of age were exposed to Mn(II) by subcutaneous injection on Day 0, 3, and 7. Brain regions, tails, and whole blood were harvested on Day 8, and total manganese levels per mg of protein were determined by GFAAS. Mean manganese levels ± SEM are shown (n = 12 to 14 samples for each genotype-exposure group; 53 animals total). Total iron levels are shown in Fig. S3. ANOVA analysis of total manganese levels showed a significant effect of Mn(II) exposure for all four brain regions (p<0.05). A significant genotype and genotype by Mn(II) exposure two-way interaction was found for the striatum only (p<0.05). Post-hoc analysis of the exposure effect showed a significant increase in manganese levels in Mn(II)-exposed animals compared to vehicle-only animals of the same genotype (p<0.05 post-hoc t-test, not indicated). Post-hoc analysis of the genotype effect found a significant difference in striatal manganese accumulation between wild-type and mutant animals as indicated (* p<0.05 post-hoc t-test).

References

    1. Anderson JG, Fordahl SC, Cooney PT, Weaver TL, Colyer CL, Erikson KM. Extracellular norepinephrine, norepinephrine receptor and transporter protein and mRNA levels are differentially altered in the developing rat brain due to dietary iron deficiency and manganese exposure. Brain Res. 2009;1281:1–14. - PMC - PubMed
    1. Apostol BL, Illes K, Pallos J, et al. Mutant huntingtin alters MAPK signaling pathways in PC12 and striatal cells: ERK1/2 protects against mutant huntingtin-associated toxicity. Hum Mol Genet. 2006;15:273–285. - PubMed
    1. Aschner M, Erikson KM, Dorman DC. Manganese dosimetry: species differences and implications for neurotoxicity. Crit Rev Toxicol. 2005;35:1–32. - PubMed
    1. Bae JH, Jang BC, Suh SI, Ha E, Baik HH, Kim SS, Lee MY, Shin DH. Manganese induces inducible nitric oxide synthase (iNOS) expression via activation of both MAP kinase and PI3K/Akt pathways in BV2 microglial cells. Neurosci Lett. 2006;398:151–154. - PubMed
    1. Beal MF, Brouillet E, Jenkins BG, et al. Neurochemical and histologic characterization of striatal excitotoxic lesions produced by the mitochondrial toxin 3-nitropropionic acid. J Neurosci. 1993;13:4181–4192. - PMC - PubMed

Publication types