Comparative Study
. 2009 Oct 21:10:487.
doi: 10.1186/1471-2164-10-487.

Analysis of genomic signatures in prokaryotes using multinomial regression and hierarchical clustering

Affiliations
Comparative Study

Analysis of genomic signatures in prokaryotes using multinomial regression and hierarchical clustering

Jon Bohlin et al. BMC Genomics. .

Abstract

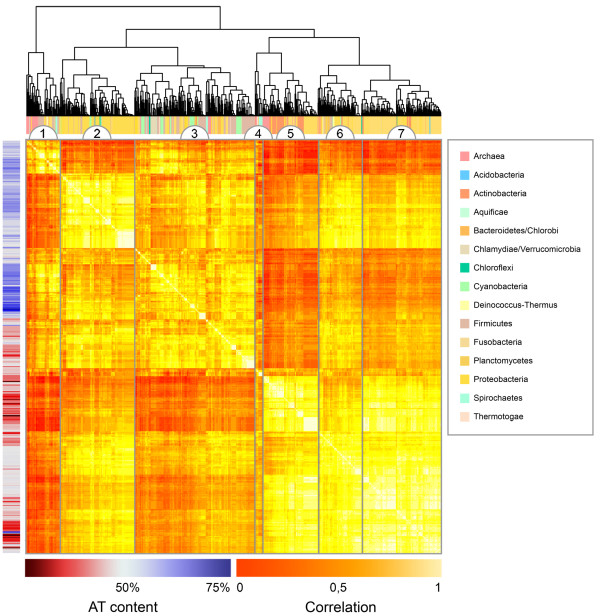
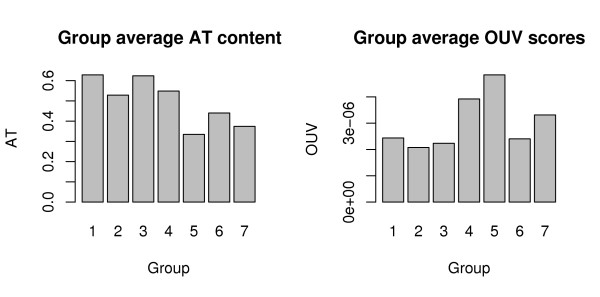
Background: Recently there has been an explosion in the availability of bacterial genomic sequences, making possible now an analysis of genomic signatures across more than 800 hundred different bacterial chromosomes, from a wide variety of environments.Using genomic signatures, we pair-wise compared 867 different genomic DNA sequences, taken from chromosomes and plasmids more than 100,000 base-pairs in length. Hierarchical clustering was performed on the outcome of the comparisons before a multinomial regression model was fitted. The regression model included the cluster groups as the response variable with AT content, phyla, growth temperature, selective pressure, habitat, sequence size, oxygen requirement and pathogenicity as predictors.

Results: Many significant factors were associated with the genomic signature, most notably AT content. Phyla was also an important factor, although considerably less so than AT content. Small improvements to the regression model, although significant, were also obtained by factors such as sequence size, habitat, growth temperature, selective pressure measured as oligonucleotide usage variance, and oxygen requirement.

Conclusion: The statistics obtained using hierarchical clustering and multinomial regression analysis indicate that the genomic signature is shaped by many factors, and this may explain the varying ability to classify prokaryotic organisms below genus level.


Figures

Figure 1
Figure 1
Cluster diagram of 867 prokaryotic genomic DNA sequences compared pair-wise using hexanucleotide-based genomic signatures. 867 prokaryotic genomic DNA sequences were compared pair-wise with hexanucleotide-based genomic signatures. Hierarchical clustering was performed on the resulting 867 × 867 correlation matrix using average linkage and Euclidean distance. The cluster diagram was grouped into different segments, Groups 1-7, based on the cluster-tree which reflected how the prokaryotic DNA sequences compared pair-wise. Lighter colors mean higher correlation scores, and thus closer similarity between the compared genomes. The multi-colored horizontal bar on top indicates each chromosome's respective phylum, while the vertical red and blue coloured bar shows AT/GC content, where red means GC content larger than 50% and blue AT content larger than 50%. Groups 5 and 7 are mainly populated with free-living, GC rich, prokaryotes with diverse metabolic capabilities. Groups 1 and 3 consist predominantly of AT rich and host-associated archaea and bacteria, while group 2 and 6 consisted mainly of larger host-associated γ-Proteobacteria. Group 4, was the smallest and most dissimilar group, consisting of many extremophiles.
Figure 2
Figure 2
Average AT scores and OUV content in cluster groups. The graphs shows average AT content (left) and OUV scores (right) on the vertical axis, for each group on the horizontal axis. High OUV scores indicate strong bias in genomic hexanucleotide usage, while low scores imply more random DNA composition. Free-living archaea and bacteria (groups 5 and 7) obtain higher average OUV scores than host-associated (groups 1 and 3), indicating pronounced differences in mutational pressures in the respective environments. Average AT content was considerably higher in the host-associated groups than in the free-living.

References

    1. DNA Databank of Japan. 2009. http://www.ddbj.nig.ac.jp/
    1. Riesenfeld CS, Schloss PD, Handelsman J. Metagenomics: Genomic analysis of microbial communities. Annual Review of Genetics. 2004;38:525–552. doi: 10.1146/annurev.genet.38.072902.091216. - DOI - PubMed
    1. Teeling H, Waldmann J, Lombardot T, Bauer M, Glockner FO. TETRA: a web-service and a stand-alone program for the analysis and comparison of tetranucleotide usage patterns in DNA sequences. BMC Bioinformatics. 2004;5:163. doi: 10.1186/1471-2105-5-163. - DOI - PMC - PubMed
    1. Karlin S, Burge C. Dinucleotide relative abundance extremes: a genomic signature. Trends Genet. 1995;11:283–290. doi: 10.1016/S0168-9525(00)89076-9. - DOI - PubMed
    1. Bohlin J, Skjerve E, Ussery D. Reliability and applications of statistical methods based on oligonucleotide frequencies in bacterial and archaeal genomes. BMC Genomics. 2008;9:104. doi: 10.1186/1471-2164-9-104. - DOI - PMC - PubMed

Publication types

LinkOut - more resources