. 2009 Oct 21:10:346.
doi: 10.1186/1471-2105-10-346.

Arabidopsis gene co-expression network and its functional modules

Affiliations

Arabidopsis gene co-expression network and its functional modules

Linyong Mao et al. BMC Bioinformatics. .

Abstract

Background: Biological networks characterize the interactions of biomolecules at a systems-level. One important property of biological networks is the modular structure, in which nodes are densely connected with each other, but between which there are only sparse connections. In this report, we attempted to find the relationship between the network topology and formation of modular structure by comparing gene co-expression networks with random networks. The organization of gene functional modules was also investigated.

Results: We constructed a genome-wide Arabidopsis gene co-expression network (AGCN) by using 1094 microarrays. We then analyzed the topological properties of AGCN and partitioned the network into modules by using an efficient graph clustering algorithm. In the AGCN, 382 hub genes formed a clique, and they were densely connected only to a small subset of the network. At the module level, the network clustering results provide a systems-level understanding of the gene modules that coordinate multiple biological processes to carry out specific biological functions. For instance, the photosynthesis module in AGCN involves a very large number (> 1000) of genes which participate in various biological processes including photosynthesis, electron transport, pigment metabolism, chloroplast organization and biogenesis, cofactor metabolism, protein biosynthesis, and vitamin metabolism. The cell cycle module orchestrated the coordinated expression of hundreds of genes involved in cell cycle, DNA metabolism, and cytoskeleton organization and biogenesis. We also compared the AGCN constructed in this study with a graphical Gaussian model (GGM) based Arabidopsis gene network. The photosynthesis, protein biosynthesis, and cell cycle modules identified from the GGM network had much smaller module sizes compared with the modules found in the AGCN, respectively.

Conclusion: This study reveals new insight into the topological properties of biological networks. The preferential hub-hub connections might be necessary for the formation of modular structure in gene co-expression networks. The study also reveals new insight into the organization of gene functional modules.


Figures
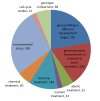
Figure 1
Figure 1
Composition of the 1094 ATH1 arrays according to the experimental conditions they represent. For a detail description of the arrays, refer to the TAIR web site .
Figure 2
Figure 2
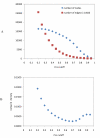
Choosing Pcc cutoff values. (A) The number of nodes and number of edges as a function of Pcc cutoff value. Only edges with Pcc greater than the cutoff value were used to construct the co-expression network. Only nodes connected by these edges were used in our network analysis. (B) Network densities at different Pcc cutoff values.
Figure 3
Figure 3
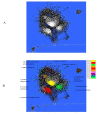
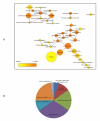
Network topology displayed using the yFiles Organic Layout algorithm in Cytoscape [20]. (A) Layout of the Arabidopsis gene co-expression network. A white rectangle represents a node (i.e. probe set). A black edge connecting two nodes indicates the co-expression relationship between these two nodes. (B) Mapping the 10 largest modules onto the network. The most over-represented biological process GO term was also shown with each module.
Figure 4
Figure 4
Topological properties of the Arabidopsis gene co-expresion network (AGCN) and the GGM network [13]. (A) Distribution of the node degree (K) for AGCN. (B) Comparing the distribution of the clustering coefficient (Ck) with respect to the node degree between AGCN and random networks. The three random networks exhibited almost identical distributions. For clarity, only one random network's distribution was shown. (C) The distribution of the module size for AGCN. (D) The distribution of the module size for GGM network.
Figure 5
Figure 5
Assessment of the quality of network clustering. (A) Comparing the effects of inflation values on area fraction and mass fraction between AGCN and three random networks. Clustering on a network with the intrinsic modular structure should produce a small area fraction but a large mass fraction close to one. This is indeed the case for the AGCN. In contrast, all three random networks had to use a large area fraction to capture a large mass fraction, suggesting the absence of modular structure. (B) Comparing the effects of inflation values on area fraction and mass fraction between AGCN and GGM network. (C) Comparing the effects of inflation values on efficiency between AGCN and three random networks. The efficiency aims to balance between the objective to obtain a high mass fraction and the objective to keep the area fraction low. A higher efficiency indicates a better performance on network clustering by using some mathematical criteria. A formal definition of efficiency can be found in [64]. (D) Comparing the effects of inflation values on efficiency between AGCN and GGM network.
Figure 6
Figure 6
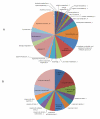
(A) Functional annotations of 127 modules with significantly over-represented biological process GO terms. The number associated with each annotation indicates the number of modules annotated to that category. See our web site for the list of 127 modules. (B) Composition of the 24 modules that were annotated to response to stimulus.
Figure 7
Figure 7
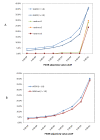
Percentage of modules with three or more members that had significantly over-represented biological process GO terms using different p-value cutoffs. For example, the data points at p-value cutoff of 5.0E-02 indicate the percentage of modules that had enriched GO terms with Bonferroni Family-Wise Error Rate (FWER) adjusted p-values less than 5.0E-02. (A) Comparing AGCN with three random networks. (B) Comparing AGCN with GGM network.
Figure 8
Figure 8
Functional analysis of module 1. (A) Significantly over-represented biological process GO terms detected in module 1. Each colored circle represents an over-represented GO term. The color scale indicates the p value of the over-represented GO term. An arrow from GO term A to Go term B indicates that A is the parent of B. (B). Seven major biological process GO terms retrieved from (A). The number following each major GO term refers to the number of genes that were annotated to that category. See our web site for the gene lists.
Figure 9
Figure 9
Tight co-expression of the 382 hub genes across all 1094 arrays in AtGenExpree. The figure was generated using MetaOmGraph, a component of the MetNet bioinformatics platform [67].
Figure 10
Figure 10
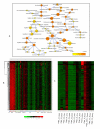
Functional analysis of module 4. (A) Significantly over-represented GO terms detected in module 4. (B) Co-expression patterns of 280 module genes over the 237 arrays which made up a gene expression map of Arabidopsis development [19]. In the heat map, each row represents a gene, and each column represents an array. Prior to hierarchical clustering, a gene's expression values over the 237 arrays were processed so that they had a zero mean and unit standard deviation. Arrays sampled from the same tissue were grouped together. 'a+l' represents the tissue that includes both shoot apex (vegetative) and young leaves. The heat map was generated using dChip software [68]. (C) A closer examination of the expression pattern of 280 module genes in different floral organs and whole flower tissues at different development stages. To generate the heat map, genes' expression values were extracted from the 280 × 237 data matrix, which were used to produce the heat map depicted in (B). Stage_XX represents a flower development stage, 'stam' represents stamen, 'carp' represents carpel, 'pedi' represents pedicel. For each experimental condition (e.g. stage_12_sepal), three replicates were measured.

References

    1. Zhang Shihua, J G, Z X-S, C L. Discovering functions and revealing mechanisms at molecular level from biological networks. Proteomics. 2007;7:2856–2869. doi: 10.1002/pmic.200700095. - DOI - PubMed
    1. Girvan M, Newman MEJ. Community structure in social and biological networks. Proceedings of the National Academy of Sciences. 2002;99:7821–7826. doi: 10.1073/pnas.122653799. - DOI - PMC - PubMed
    1. Carlson MRJ, Zhang B, Fang ZX, Mischel PS, Horvath S, Nelson SF. Gene connectivity, function, and sequence conservation: predictions from modular yeast co-expression networks. BMC Genomics. 2006;7:15. doi: 10.1186/1471-2164-7-40. - DOI - PMC - PubMed
    1. Freeman TC, Goldovsky L, Brosch M, Van Dongen S, Maziere P, Grocock RJ, Freilich S, Thornton J, Enright AJ. Construction, visualisation, and clustering of transcription networks from Microarray expression data. PLoS Comput Biol. 2007;3:2032–2042. doi: 10.1371/journal.pcbi.0030206. - DOI - PMC - PubMed
    1. Jordan IK, Marino-Ramirez L, Wolf YI, Koonin EV. Conservation and Coevolution in the Scale-Free Human Gene Coexpression Network. Mol Biol Evol. 2004;21:2058–2070. doi: 10.1093/molbev/msh222. - DOI - PubMed

Publication types

MeSH terms

Substances

LinkOut - more resources