Review
. 2009 Dec;182(6 Suppl):S18-26.
doi: 10.1016/j.juro.2009.08.070.

Diabetic bladder dysfunction: current translational knowledge

Affiliations
Review

Diabetic bladder dysfunction: current translational knowledge

Firouz Daneshgari et al. J Urol. 2009 Dec.

Abstract

Purpose: Diabetes mellitus, a metabolic disorder caused by an absolute or relative deficiency of insulin, is a debilitating and costly disease with multiple serious complications. Lower urinary tract complications are among the most common complications of diabetes mellitus. The most common, bothersome lower urinary tract complication of diabetes mellitus is diabetic cystopathy or diabetic bladder dysfunction. We reviewed the current translational knowledge of diabetic bladder dysfunction.

Materials and methods: We performed a search of the English literature through PubMed. The key words used were diabetes and bladder dysfunction or cystopathy. Our data and perspective are provided for consideration of the future direction of research.

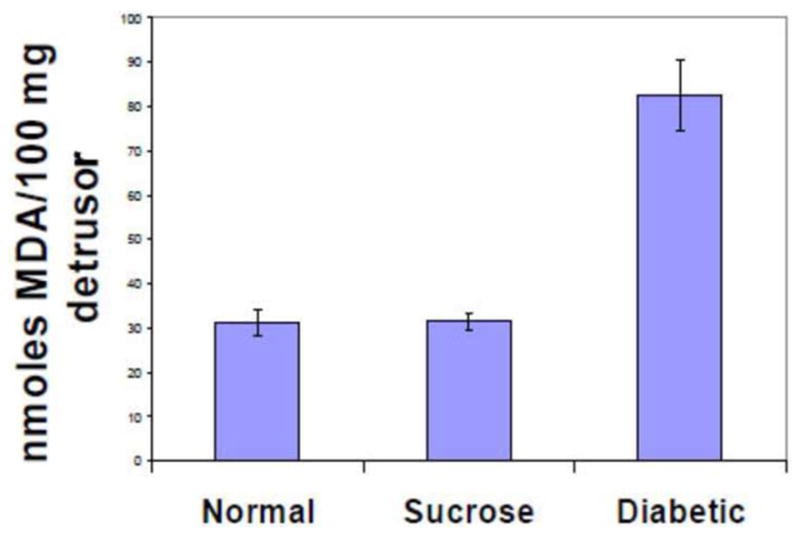
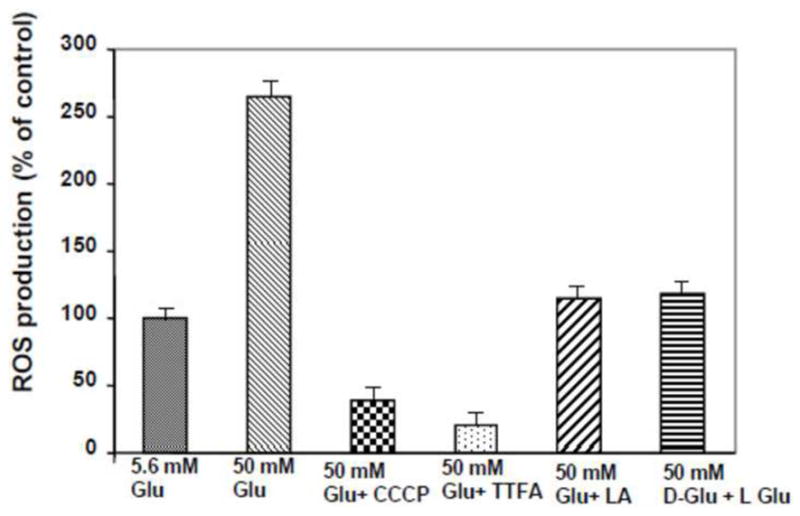
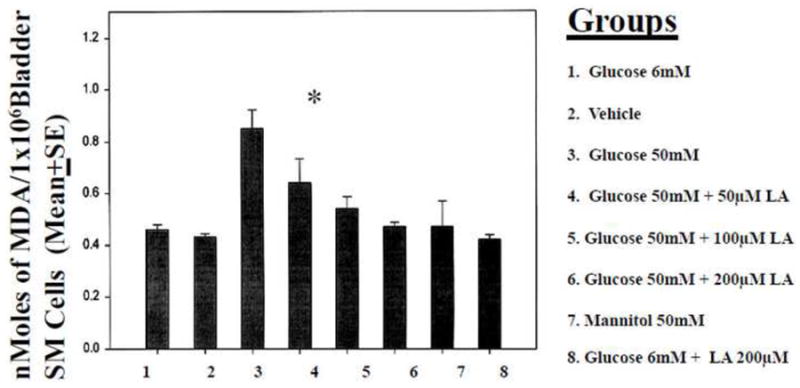
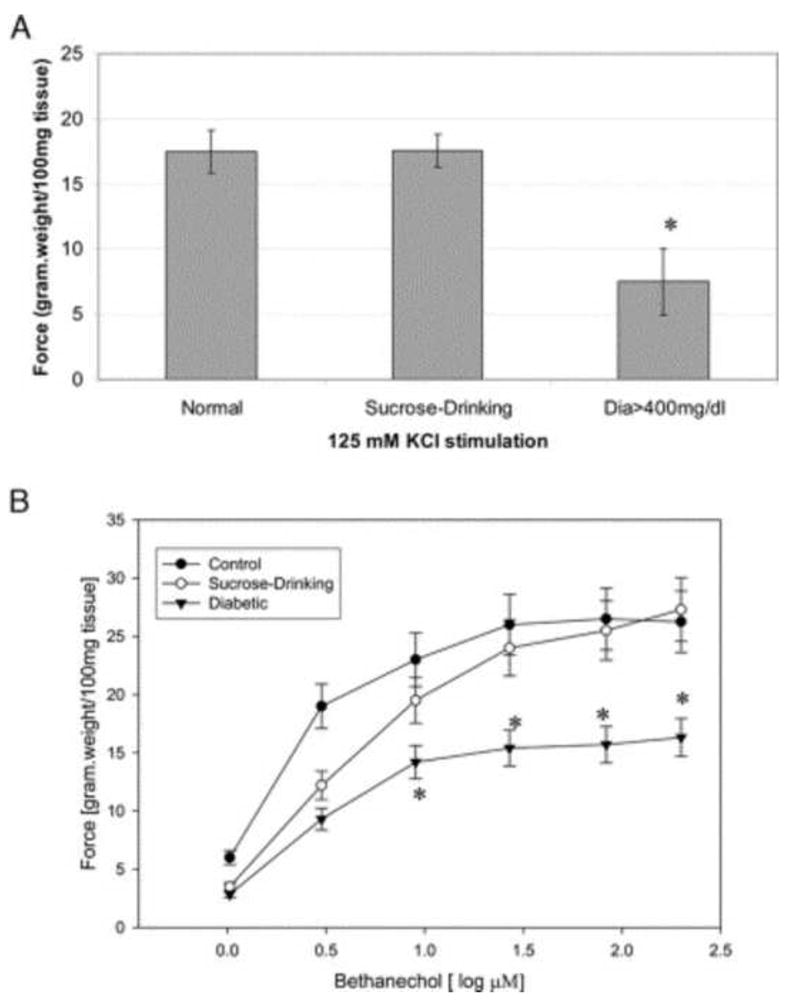
Results: Despite traditional recognition of diabetic bladder dysfunction as a voiding problem characterized by poor emptying and overflow incontinence, recent clinical and experimental evidence indicate storage problems such as urgency and urge incontinence in diabetes mellitus cases. Recent experimental evidence from studies of diabetic bladder dysfunction in small animal models of diabetes mellitus show a temporal effect on diabetic bladder dysfunction. Early phase diabetes mellitus causes compensated bladder function and the late phase causes decompensated bladder function. The temporal theory could plausibly provide the scientific road map to correlate clinical and experimental findings, and identify the role of mechanisms such as polyuria, hyperglycemia, oxidative stress, autonomic neuropathy and decompensation of the bladder contractile apparatus in the creation of clinical and experimental manifestations of diabetic bladder dysfunction.

Conclusions: Diabetic bladder dysfunction includes time dependent manifestations of storage and emptying problems. Identifying mechanistic pathways would lead to the identification of therapeutic intervention.


Figures

Figure 1
Figure 1. Increase in Lipid Peroxidation
Products in Detrusor MDA levels are given for detrusor from normal (N=11), sucrose fed controls (N=13) and diabetic rabbits (N=5). MDA levels were significantly higher in detrusor muscle from diabetic rabbits compared to normal and sucrose feed controls. Data are given as mean±S.E. *, p<0.05 compared to normal sucrose.
Figure 2
Figure 2. Mitochondrial ROS production
Incubation of human BSM cells with high glucose increases ROS generation and is prevented by the antioxidants alpha lipoic acid. Human BSM cells were grown with low (6mM) and high (50 mM) glucose plus 10 uM TTFA, 1uM CCCP, 200 uM of alpha lipoic acid and 50 mM of L-glucose for 48 hrs. The mitochondrial fractions were assayed for the ROS production. The ROS concentration was determined from a standard curve of H2O2 (95-100 umol/l) and was expressed as a percentage of ROS incubated at 6 mmol/l glucose.
Figure 3
Figure 3. Lipid peroxidation induced by high glucose
Increase in lipid peroxidation products in BSM cells treated with high glucose (50 mM). Mannitol 50 mM treated group served as control for osmotic shock. High glucose (50 mM) induced lipid peroxidation, was inhibited by lipoic acid treatment (4&5). Normal (6 mM) glucose treatment and mannitol treatment did not induce any changes in lipid peroxidation. *p<0.05 compared to Glucose 6 mM.
Figure 4
Figure 4. Force generation by detrusor muscle strips
A, effects of 125 mM KCl on force generation by detrusor muscle from normal, sucrose drinking and diabetic (Dia>400mg/dl) rabbits. Force was significantly decreased for diabetes. Data are shown as mean ± SEM. Asterisk indicates p <0.05. B, bethanechol dose response curve of force generation by detrusor muscle from normal, sucrose drinking and diabetic rabbits. Force was significantly decreased for diabetes. Data are shown as mean ± SEM. Asterisk indicates p <0.05. (Reproduced from Changolkar et al., 2005 with permission.)
Figure 5
Figure 5. Expression of Rho-kinase at both mRNA and protein level
A: real-time PCR standard curve for Rho-kinase B: average of required PCR cycle numbers to reach crossing threshold. The required PCR cycle numbers was 27.3 for normal samples, 26.9 for diuretic controls, and 23.5 for diabetic samples. A significantly lower number of PCR cycles for the diabetic sample indicated that diabetic DSM sample had more copies of Rho-kinase transcript. C: Western blot for Rho-kinase and smooth muscle -actin. D: bar graph showing the average of relative protein expression level. There was almost a 2.1-fold higher protein expression of Rho-kinase in diabetic detrusor compared with normal and diuretic samples. *Significant difference between samples (n = 4, P < 0.01). (Reproduced with permission from Chang et al, 2006.).
Figure 6
Figure 6. Expression of CPI-17 at both mRNA and protein level
A: standard curve of real-time PCR for CPI-17. B: average of the PCR results. The required PCR cycle numbers was significantly decreased in diabetic DSM samples compared with normal or diuretic controls. It was 31.4 cycles for normal sample, 31.6 cycles for diuretic controls, and 26.1 cycles for diabetic samples. C: Western blot for CPI-17. D: bar graph showing the relative expression of CPI-17 at the protein level. There was almost a 2.5-fold higher expression of CPI-17 at the protein level in diabetic detrusor compared with normal and diuretic samples. *Significant difference between samples (n = 4, P < 0.01). (Reproduced with permission from Chang et al, 2006.).
Figure 7
Figure 7. Selected areas from 2-dimensional (2D) gel showing basal MLC20 phosphorylation in normal, diuretic, and diabetic detrusor smooth muscle (DSM)
A: normal. B: diuretic. C: diabetic. D: bar graph showing the average values of myosin light chain (MLC) phosphorylation. Phosphorylated MLC20 (P-MLC20) runs slightly higher and more toward the acidic side than unphosphorylated MLC20 (UP-MLC20) in the gel. The basal phosphorylation of MLC20 was 18% in normal DSM. Diuretic control had a very similar level (19.2%) of MLC20 phosphorylation. However, the phosphorylation level was significantly increased to 28% in diabetic detrusor. *Significant difference between samples (n = 3, P < 0.05). (Reproduced with permission from Chang et al, 2006.).

References

    1. Centers for Disease Control and Prevention. National diabetes fact sheet: general information and national estimates on diabetes in the United States. 2005
    1. Bladder Research Progress Review Group. Urologic complications of diabetes mellitus in overcoming bladder disease: a strategic plan for research. A report of the NIH-NIDDK bladder research progress review group. 2004
    1. Bladder Research Progress Review Group. Urologic complications of diabetes mellitus. 2002;133
    1. Daneshgari F, Moore C. Diabetic uropathy. Semin Nephrol. 2006;26:182. - PubMed
    1. Zderic SA, Chacko S, Disanto ME, Wein AJ. Voiding function: relevant anatomy, physiology, pharmacology, and molecular aspects. 2002

Publication types

MeSH terms