. 2009 Oct 21;29(42):13344-52.
doi: 10.1523/JNEUROSCI.3546-09.2009.

The time course of dopamine transmission in the ventral tegmental area

Affiliations

The time course of dopamine transmission in the ventral tegmental area

Christopher P Ford et al. J Neurosci. .

Abstract

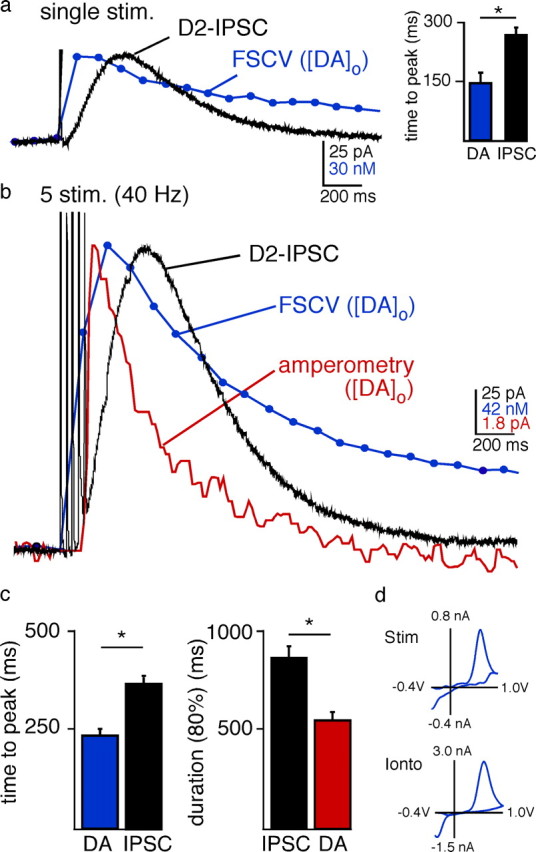
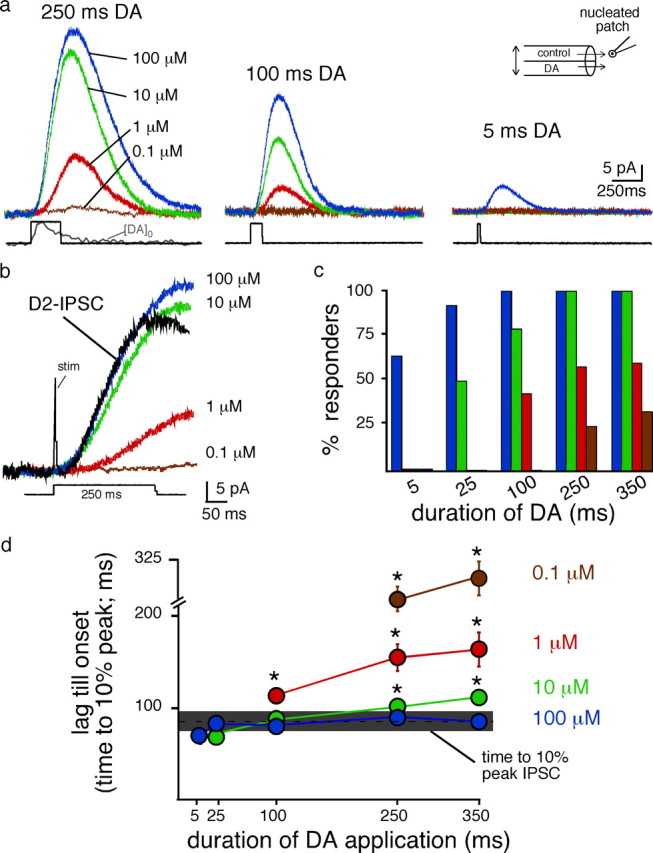
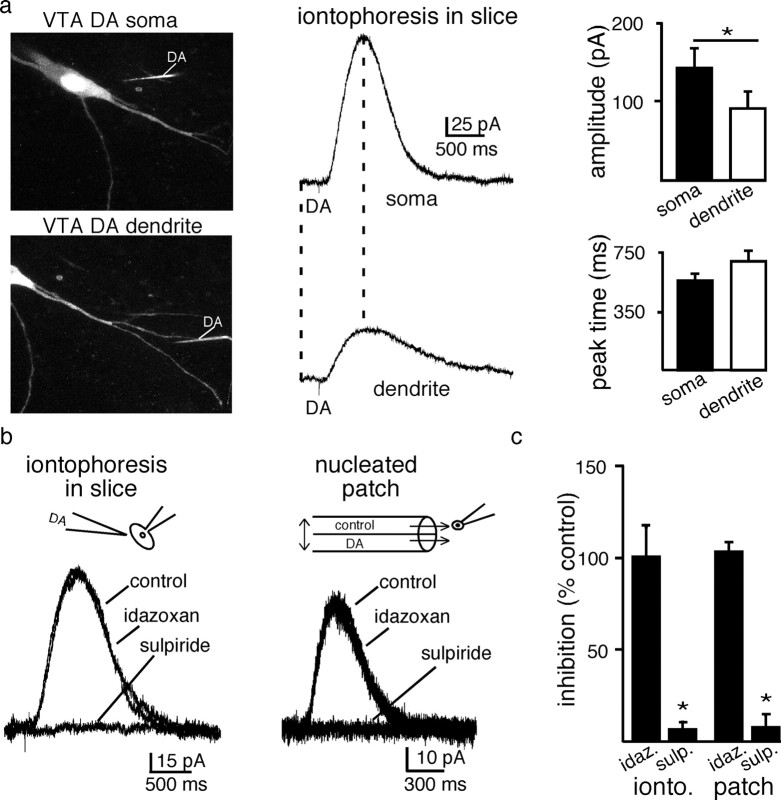
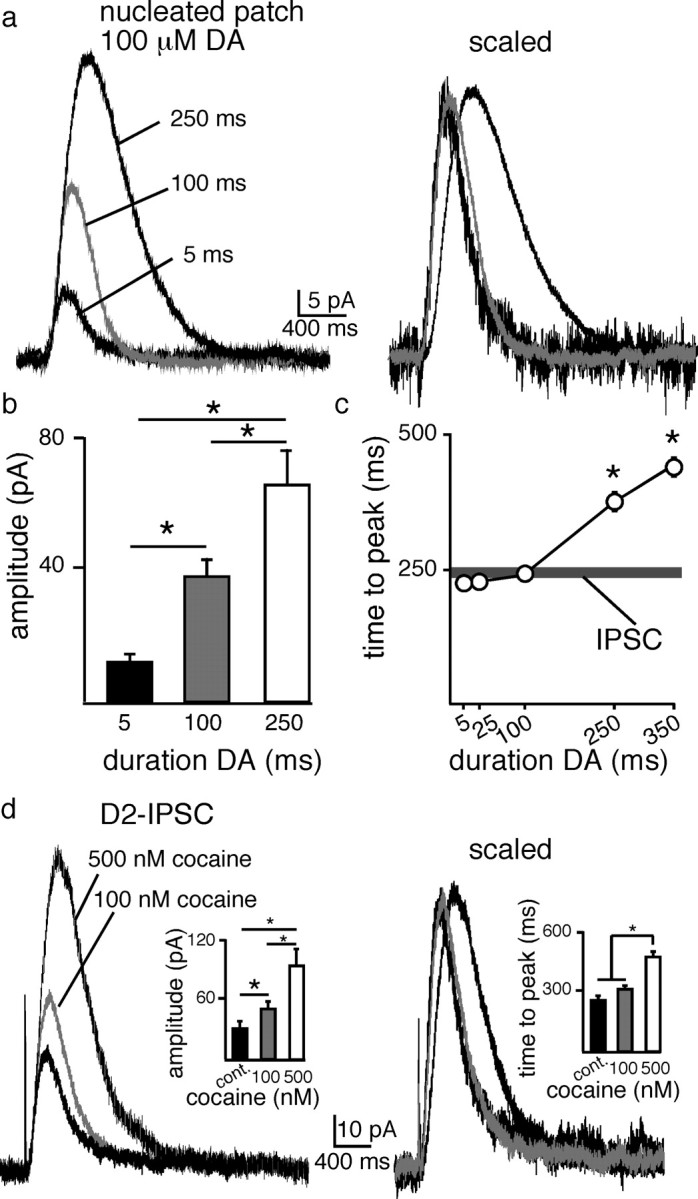
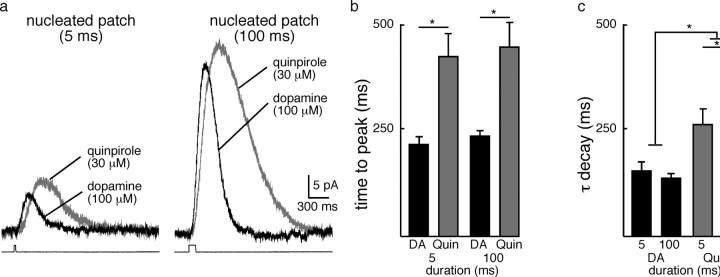
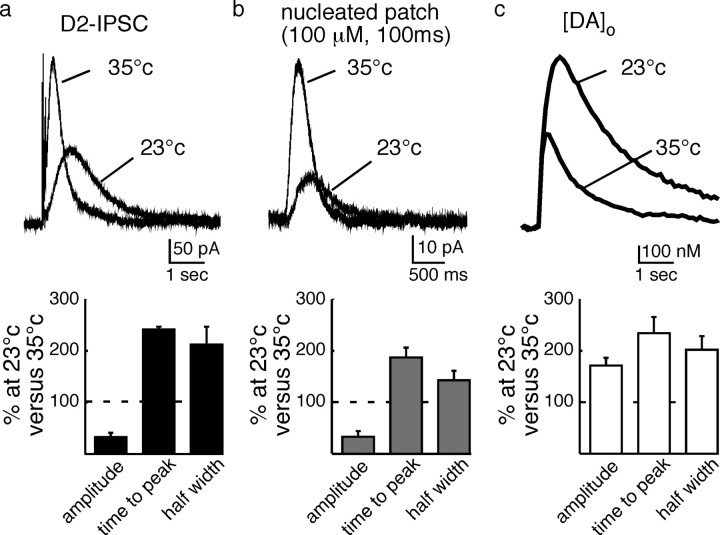
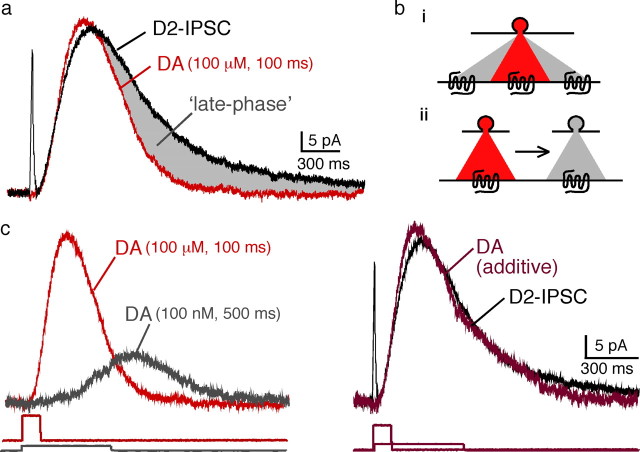
Synaptic transmission mediated by G-protein coupled receptors (GPCR) is not generally thought to be point-to-point. To determine the extent over which dopamine signals in the midbrain, the present study examined the concentration and time course of dopamine that underlies a D(2)-receptor IPSC (D(2)-IPSC) in the ventral tegmental area. Extracellular dopamine was measured electrochemically while simultaneously recording D(2)-IPSCs. The presence of dopamine was brief relative to the IPSC, suggesting that G-protein dependent potassium channel activation determined the IPSC time course. The activation kinetics of D(2) receptor-dependent potassium current was studied using outside-out patch recordings with rapid application of dopamine. Dopamine applied at a minimum concentration of 10 mum for a maximum of 100 ms mimicked the IPSC. Higher concentrations applied for as little as 5 ms did not change the kinetics of the current. The results indicate that both the intrinsic kinetics of G-protein coupled receptor signaling and a rapidly rising high concentration of dopamine determine the time course of the IPSC. Thus, dopamine transmission in the midbrain is more localized then previously proposed.


Figures

Figure 1.
Figure 1.
Comparing the time course of [DA]o and the D2-IPSC. a, Simultaneous recordings illustrating the change in [DA]o measured by FSCV (blue trace average of recordings n = 17) and a D2-IPSC (black trace, trace is average of n = 17) in the VTA. A single stimulus from an extracellular electrode in the VTA (0.6 ms) evoked a rapid rise in dopamine release and an IPSC. A triangular waveform (−0.4 V to 1.0 V at 300 V/S) was used to measure [DA]o with FSCV. Waveform-induced artifacts in the electrophysiological trace were blanked. b, Simultaneous measurements of changes in [DA]o by FSCV (traces are average of n = 17 slices; blue trace) and amperometry (constant potential = 300 mV, n = 12; red trace) and the D2-IPSC (black trace, n = 17 cells) in the VTA evoked by a train of 5 stimuli (40 Hz). c, The time to peak of the IPSC was significantly longer than the time to peak for the increase in [DA]o measured by FSCV. The duration of the IPSC was also longer than the [DA]o measured by amperometry (*p < 0.05). d, Voltammograms from the peak of the FSCV (n = 9) matched well with those produced by the exogenous iontophoretic application of dopamine (n = 3), confirming that dopamine was oxidized by the carbon fiber following stimulation.
Figure 2.
Figure 2.
Currents elicited by the fast-flow application of dopamine to nucleated patches. a, Representative recordings illustrating outward currents generated from rapid application of dopamine onto outside-out nucleated nucleated macro-patches. The amplitude of current increased as a function of concentration and duration. Dopamine was applied from a theta tube positioned directly in front of the nucleated patches (inset). Square pulses illustrated below are the open-tip current recorded as the junction-current associated from switching the open pipette tip from control to solution of elevated NaCl. Gray [DA]o trace is the average of 17 traces of the amperometric current resulting from a single stimuli in the VTA. b, Expanded traces illustrated in panel A for the 250 ms application of dopamine. Black trace is an example of a D2-IPSC evoked from a single pulse stimulus. Note that the current induced by dopamine (1 μm or 100 nm) was slow to activate. Scale bar applies to all traces. c, Summarized data illustrating the proportion of patches where an outward current was obtained at each concentration and duration (responders). Colors represent blue: 100 μm, green: 10 μm, red: 1 μm and brown: 100 nm. d, Summarized data illustrating the lag of activation of the outward current. The lag was determined as the time to reach 10% of the peak response between stimulation of an IPSC (horizontal gray bar) or the current induced by application of dopamine to nucleated patches. Horizontal gray bar represents the 95% confidence interval (×2 SD) for the IPSC evoked from a single pulse.
Figure 3.
Figure 3.
D2-receptors mediate currents in the soma and dendrites a, Image of a dopamine neuron taken with a two-photon microscope, illustrating the location of the labeled iontophoretic dopamine pipette used to activate the currents illustrated on the right. The cell was imaged using an internal solution containing Alexa Fluor488 (2 μm). The iontophoretic pipette included sulforhodamine 101 (300 μm). The fine tip of the iontophoretic electrode (not clearly visible) was placed ∼1–2 μm from the plasma membrane in each case. Bar graphs are summarized data showing the average amplitude and time to peak of the outward current induced by dopamine applied to the soma and their dendrites. Dendritic sites were ≥50 μm from the soma (n = 5). b, GIRK evoked currents evoked by the iontophoresis of dopamine onto VTA dopamine neurons in the slice and onto nucleated nucleated macro-patches pulled from VTA dopamine neurons (DA 100 μm, 100 ms). The currents induced by dopamine applied by iontophoresis or in the patch recordings were blocked by the D2-receptor antagonist sulpiride (200 nm) but not the α2-receptor antagonist idazoxan (1 μm) (iontophoretic experiments, n = 6; patch experiments sulpiride n = 5, idazoxan n = 3). c, Summarized data illustrating the pharmacological block of D2-receptors.
Figure 4.
Figure 4.
Intrinsic time course of D2-receptor activation of GIRK current. a, Dopamine (100 μm) evoked GIRK currents from nucleated patches. Increasing the duration of application produced an increase in amplitude. Applications ranging from 5 to 100 ms did not change the time course of the outward current as indicated by the currents after being scaled to the peak. Application of dopamine for 250 ms activated a larger current that reached a peak later than currents induced by short applications of dopamine. b, Summary illustrating the increase in amplitude for 5 ms (n = 9), 100 ms (n = 14) and 250 ms (n = 13) applications of dopamine. c, Summary illustrating the time to peak after application of dopamine (100 μm) for various durations. Horizontal dark gray bar represents the mean ± SEM of the time to peak of IPSC evoked from a single pulse. d, Representative traces illustrating the effect of cocaine on D2-IPSCs. Low concentrations of cocaine (100 nm) increased the amplitude but not the time to peak of the IPSC (n = 9), while higher concentrations (500 nm, n = 8) further increased the amplitude and also the time to peak.
Figure 5.
Figure 5.
Kinetics of currents induced by D2 receptors are agonist dependent. a, Currents evoked with 5 or 100 ms application of dopamine (100 μm) or quinpirole (30 μm). Quinpirole evoked a current that rose to peak later than a similar application of dopamine. The time course of decay of the current induced by quinpirole was also slower. b, Summarized data illustrating the time peak, dopamine (n = 15), quinpirole (n = 7). *p < 0.0001. c, Summarized data illustrating the time constant of decay (τ decay) of dopamine (n = 15) and quinpirole (n = 7). *p < 0.0001.
Figure 6.
Figure 6.
Low temperature decreases the amplitude and increases the duration of the IPSC by a postsynaptic mechanism. a, Top, Examples of D2-IPSCs evoked at 35 and 23°C; bottom, summarized data showing the change in IPSC amplitude, time to peak, and half width induced by lowering the temperature. b, Top, Example traces from patch recordings at two temperatures; bottom, summarized data from the patch recording. c, Top, Example traces of the extracellular dopamine measured with FSCV in brain slices at two temperatures. Bottom, Summarized data from the FSCV experiment illustrated above.
Figure 7.
Figure 7.
Schematic illustrating how the release of dopamine may mediate the IPSC. a, Comparison of the D2-IPSC (black) with the current evoked by dopamine (100 μm, 100 ms, red). The duration of the IPSC is longer than the current evoked by a brief application of dopamine (gray). b, Two models may account for the late phase of the IPSC: increased diffusion of low [DA] to recruit new receptors (i), diffusion of the peak [DA] over time to prolong the duration of receptor signaling (ii). c, Left shows currents in patch recordings induced by 2 applications of dopamine. The red trace is the current induced by a 100 ms application of 100 μm, and the gray trace is that induced by a 500 ms application of 100 nm. Right illustrates the IPSC (black trace) and a dark red trace that is the sum of the short (red) and long (gray) traces from the experiment shown on the left. The traces below are the open tip recordings illustrating the time of application of dopamine.

Similar articles

Cited by

References

    1. Balakrishnan V, Kuo SP, Roberts PD, Trussell LO. Slow glycinergic transmission mediated by transmitter pooling. Nat Neurosci. 2009;12:286–294. - PMC - PubMed
    1. Barbour B, Keller BU, Llano I, Marty A. Prolonged presence of glutamate during excitatory synaptic transmission to cerebellar Purkinje cells. Neuron. 1994;12:1331–1343. - PubMed
    1. Bath BD, Michael DJ, Trafton BJ, Joseph JD, Runnels PL, Wightman RM. Subsecond adsorption and desorption of dopamine at carbon-fiber microelectrodes. Anal Chem. 2000;72:5994–6002. - PubMed
    1. Beato M. The time course of transmitter at glycinergic synapses onto motoneurons. J Neurosci. 2008;28:7412–7425. - PMC - PubMed
    1. Beckstead MJ, Grandy DK, Wickman K, Williams JT. Vesicular dopamine release elicits an inhibitory postsynaptic current in midbrain dopamine neurons. Neuron. 2004;42:939–946. - PubMed

Publication types

MeSH terms

LinkOut - more resources