

Paper-supported 3D cell culture for tissue-based bioassays
- PMID: 19846768
- PMCID: PMC2773961
- DOI: 10.1073/pnas.0910666106
Paper-supported 3D cell culture for tissue-based bioassays
Abstract
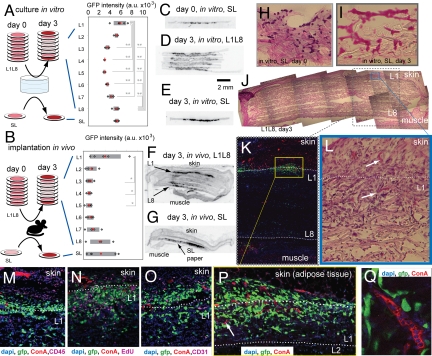
Fundamental investigations of human biology, and the development of therapeutics, commonly rely on 2D cell-culture systems that do not accurately recapitulate the structure, function, or physiology of living tissues. Systems for 3D cultures exist but do not replicate the spatial distributions of oxygen, metabolites, and signaling molecules found in tissues. Microfabrication can create architecturally complex scaffolds for 3D cell cultures that circumvent some of these limitations; unfortunately, these approaches require instrumentation not commonly available in biology laboratories. Here we report that stacking and destacking layers of paper impregnated with suspensions of cells in extracellular matrix hydrogel makes it possible to control oxygen and nutrient gradients in 3D and to analyze molecular and genetic responses. Stacking assembles the "tissue", whereas destacking disassembles it, and allows its analysis. Breast cancer cells cultured within stacks of layered paper recapitulate behaviors observed both in 3D tumor spheroids in vitro and in tumors in vivo: Proliferating cells in the stacks localize in an outer layer a few hundreds of microns thick, and growth-arrested, apoptotic, and necrotic cells concentrate in the hypoxic core where hypoxia-sensitive genes are overexpressed. Altering gas permeability at the ends of stacks controlled the gradient in the concentration of the O(2) and was sufficient by itself to determine the distribution of viable cells in 3D. Cell cultures in stacked, paper-supported gels offer a uniquely flexible approach to study cell responses to 3D molecular gradients and to mimic tissue- and organ-level functions.
Conflict of interest statement
The authors declare no conflict of interest.
Figures

Similar articles
-
Microfluidic 3D cell culture: potential application for tissue-based bioassays.Bioanalysis. 2012 Jun;4(12):1509-25. doi: 10.4155/bio.12.133. Bioanalysis. 2012. PMID: 22793034 Free PMC article. Review.
-
Multizone paper platform for 3D cell cultures.PLoS One. 2011 May 6;6(5):e18940. doi: 10.1371/journal.pone.0018940. PLoS One. 2011. PMID: 21573103 Free PMC article.
-
A paper-based invasion assay: assessing chemotaxis of cancer cells in gradients of oxygen.Biomaterials. 2015 Jun;52:262-71. doi: 10.1016/j.biomaterials.2015.02.012. Epub 2015 Feb 28. Biomaterials. 2015. PMID: 25818432
-
Production of Uniform 3D Microtumors in Hydrogel Microwell Arrays for Measurement of Viability, Morphology, and Signaling Pathway Activation.Assay Drug Dev Technol. 2015 Nov;13(9):570-83. doi: 10.1089/adt.2015.662. Epub 2015 Aug 14. Assay Drug Dev Technol. 2015. PMID: 26274587 Free PMC article.
-
Spheroids as a Type of Three-Dimensional Cell Cultures-Examples of Methods of Preparation and the Most Important Application.Int J Mol Sci. 2020 Aug 28;21(17):6225. doi: 10.3390/ijms21176225. Int J Mol Sci. 2020. PMID: 32872135 Free PMC article. Review.
Cited by
-
Scaffold-based tissue engineering strategies for soft-hard interface regeneration.Regen Biomater. 2022 Nov 12;10:rbac091. doi: 10.1093/rb/rbac091. eCollection 2023. Regen Biomater. 2022. PMID: 36683751 Free PMC article. Review.
-
Exploring New Dimensions of Tumor Heterogeneity: The Application of Single Cell Analysis to Organoid-Based 3D In Vitro Models.Adv Healthc Mater. 2023 Oct;12(26):e2300903. doi: 10.1002/adhm.202300903. Epub 2023 Aug 27. Adv Healthc Mater. 2023. PMID: 37589373 Free PMC article. Review.
-
Three-Dimensional In Vitro Cell Culture Models for Efficient Drug Discovery: Progress So Far and Future Prospects.Pharmaceuticals (Basel). 2022 Jul 27;15(8):926. doi: 10.3390/ph15080926. Pharmaceuticals (Basel). 2022. PMID: 36015074 Free PMC article. Review.
-
Microfluidics-based 3D cell culture models: Utility in novel drug discovery and delivery research.Bioeng Transl Med. 2016 Jul 5;1(1):63-81. doi: 10.1002/btm2.10013. eCollection 2016 Mar. Bioeng Transl Med. 2016. PMID: 29313007 Free PMC article. Review.
-
Simple and Inexpensive Paper-Based Astrocyte Co-culture to Improve Survival of Low-Density Neuronal Networks.Front Neurosci. 2018 Feb 27;12:94. doi: 10.3389/fnins.2018.00094. eCollection 2018. Front Neurosci. 2018. PMID: 29535595 Free PMC article.
References
-
- Minchinton AI, Tannock IF. Drug penetration in solid tumours. Nat Rev Cancer. 2006;6:583–592. - PubMed
-
- Malda J, Klein TJ, Upton Z. The roles of hypoxia in the In vitro engineering of tissues. Tissue Eng Part A. 2007;13:2153–2162. - PubMed
-
- Yamada KM, Cukierman E. Modeling tissue morphogenesis and cancer in 3D. Cell. 2007;130:601–610. - PubMed
-
- Pampaloni F, Reynaud EG, Stelzer EHK. The third dimension bridges the gap between cell culture and live tissue. Nat Rev Mol Cell Biol. 2007;8:839–845. - PubMed
Publication types
MeSH terms
Substances
Grants and funding
LinkOut - more resources
Full Text Sources
Other Literature Sources
