. 2009 Dec 10;114(25):5173-81.
doi: 10.1182/blood-2009-07-235960.

An in vitro model of differentiation of memory B cells into plasmablasts and plasma cells including detailed phenotypic and molecular characterization

Affiliations

An in vitro model of differentiation of memory B cells into plasmablasts and plasma cells including detailed phenotypic and molecular characterization

Michel Jourdan et al. Blood. .

Abstract

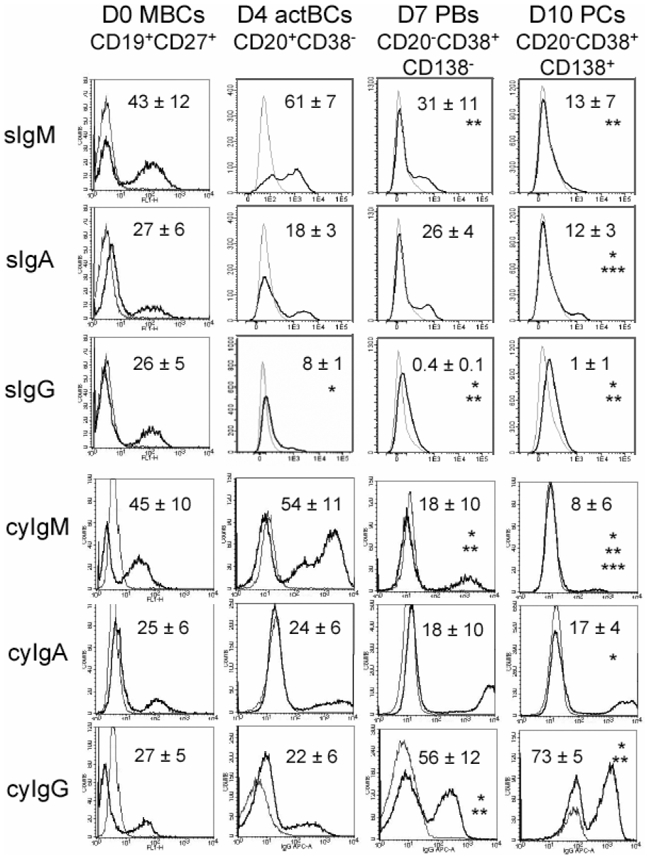
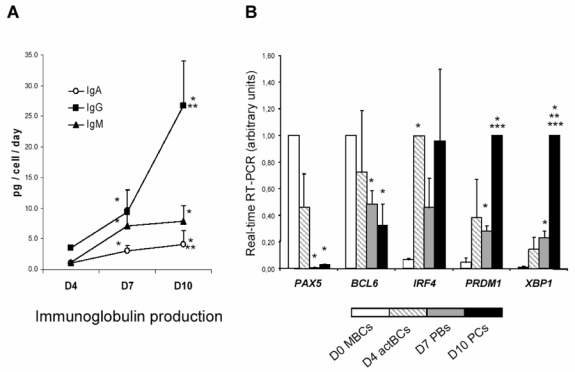
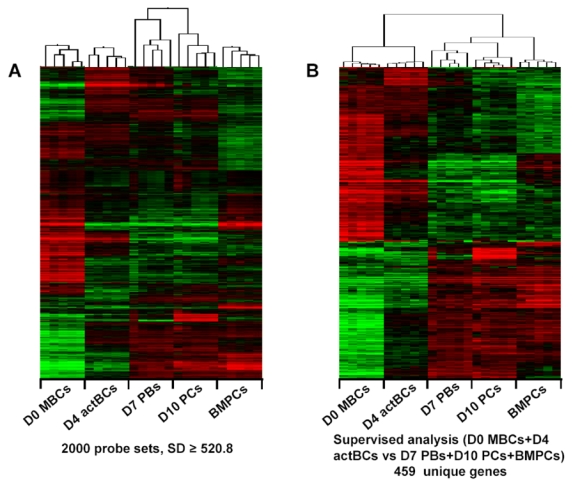
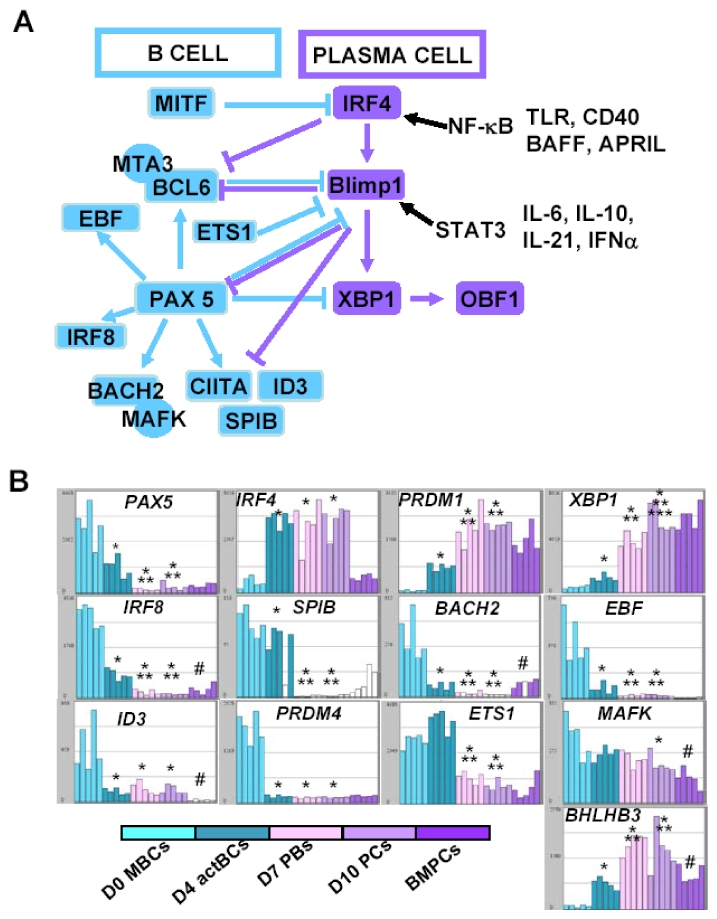
Human plasma cells (PCs) and their precursors play an essential role in humoral immune response but are rare and difficult to harvest. We report the generation of human syndecan-1(+) and immunoglobulin secreting PCs starting from memory B cells in a 3-step and 10-day (D) culture, including a 6-fold cell amplification. We report the detailed phenotypic and Affymetrix gene expression profiles of these in vitro PCs as well as of intermediate cells (activated B cells and plasmablasts) compared with memory B cells and bone marrow PCs, which is accessible through an open web ATLAS (http://amazonia.transcriptome.eu/). We show this B cell-to-PC differentiation to involve IRF4 and AICDA expressions in D4 activated B cells, decrease of PAX5 and BCL6 expressions, and increase in PRDM1 and XBP1 expressions in D7 plasmablasts and D10 PCs. It involves down-regulation of genes controlled by Pax5 and induction of genes controlled by Blimp-1 and XBP1 (unfold protein response). The detailed phenotype of D10 PCs resembles that of peripheral blood PCs detected after immunization of healthy donors. This in vitro model will facilitate further studies in PC biology. It will likewise be helpful to study PC dyscrasias, including multiple myeloma.


Figures

Figure 1
Figure 1. Three-step in vitro model of plasma cell generation
Peripheral blood human memory B cells (MBCs) were purified and cultured with sCD40L, ODN and IL-2+IL-10+IL-15, then with IL-2+IL-6+IL-10+IL-15+ for 3 days and then with IFN-α+IL-6+IL-15 for 3 days. Cells were labeled with anti-CD20, CD38 and anti-CD138 mAbs, CD20+CD38 D4 actBCs, CD20CD38++ D4 or D7 PBs, and CD20CD38++CD138+ D10 PCs were FACS sorted and stained with May-Grünwald-Giemsa (x1000 magnification). The percentage of cells in the S-phase of the cell cycle was determined using propidium iodide and data were analyzed with the ModFit LT software. Histograms are those of one experiment representative of 3.
Figure 2
Figure 2. Expression of surface and cytoplasmic immunoglobulin heavy chain isotypes by B cells and plasma cells generated in the 3-step culture system
MBCs were cultured as described in Figure 1. Starting MBCs, D4 actBCs, D7 PBs and D10 PCs were labeled with fluorochrome-conjugated anti-CD20, CD38 and CD138 mAbs and with fluorochrome-conjugated anti-human IgM, IgA, IgG mAbs or isotype-controlled mAbs before or after cell permeabilization. The bold histograms represent labeling with anti-IgM, IgA or IgG mAb and the light ones with the control mAb. Histograms are those of one experiment representative of five. The numbers in the panels are the means ± SD of the percentage of labeled cells (i.e. ≥ MFI + 1SD of the control mAb). * indicates that the mean percentage of labeled cells is different from that in D0 MBCs, ** from that in D4 actBCs, and from that in D7 PBs.
Figure 3
Figure 3. Immunoglobulin production and gene expression of transcription factors involved in B cells to plasma cell differentiation
A. MBCs were cultured as described in Figure 1 and culture supernatants were harvested at day 4, day 7 and day 10 to assay for IgM, IgA and IgG concentrations using nephelometry. The rate of Ig production per cell and per day was calculated dividing the amount of Igs in the culture supernatant by the number of viable cells at the time of culture supernatant harvesting and by the number of days of culture. Data are the means ± SD of the rates of Ig production determined in 5 separate experiments. * indicates that the rate of Ig productions are different from those at day 4 and ** from those at day 7. B. D0 MBCs, D4 actBCs, D7 PBs and D10 PCs were FACS sorted and the expression of PAX5, BCL6, IRF4, PRDM1 and XBP1 genes was evaluated by real time RT-PCR. The gene expression in the different cell populations was compared assigning the arbitrary value 1 to the maximal expression. Data are the mean value ± SD of gene expression determined in 5 separate experiments. * indicates that the mean expression is different from that in D0 MBCs, ** from that in D4 actBCs, and from that in D7 PBs.
Figure 4
Figure 4. Phenotype and expression of homing molecules of B cells and plasma cells generated in the 3-step culture system
MBCs were cultured as described in Figure 1. Cells were stained for CD20, CD38, and CD138. The cell phenotype was analyzed by gating on CD20+CD38 lymphocytes, CD20CD38++CD138 D7 PBs and CD20CD38++CD138+ D10 PCs. A. Black histograms show FACS labeling with anti-CD19, CD27, CD45, HLA class II, Ki-67 (after cell permeabilization), and CD43. Gray histograms display the corresponding negative control mAbs. Data from one experiment representative of 3 are shown. Numbers in panels indicate mean values ± SD of the percentage of positive cells of 3 separate experiments and numbers in brackets the mean staining indexes ± SD. B. Black histograms show FACS labeling with anti-CXCR5, CXCR4, CCR10, and CD62L mAbs. Gray histograms display the corresponding negative control mAbs. Data from one experiment representative of 3 are shown. Numbers in panels indicate mean values ± SD of the percentage of positive cells and numbers in brackets the mean staining indexes ± SD of 3 separate experiments. * indicates that the value is different from that in D0 MBCs using a paired t-test, ** from that in D4 actBCs, and from that in D7 PBs.
Figure 5
Figure 5. Gene expression profiles of B cells and plasma cells generated in the 3-step culture system, of memory B cells and bone marrow plasma cells
The gene expression profile of purified B cells or PC populations (5 separate samples for each population) was determined with Affymetrix U133 Plus 2.0 microarrays. A. An unsupervised hierarchical clustering was run with the 2000 probe sets with the highest standard deviation (log transform, center genes and arrays, uncentered correlation and average linkage). The dendogram shows that all samples of a given population (D0 MBCs, D4 actBCs, D7 PBs, D10 PCs, and BMPCs) strongly cluster together (r ≥ .5) and that D7 PBs and D10 PCs are correlated together unlike other populations. B. The probe sets differentially expressed between D0 MBCs+D4 actBCs and D7 PBS+D10 PCS+ BMPCs were determined with a SAM supervised analysis (Wilcoxon statistic, 2 fold ratio, 0% FDR), identifying 459 unique genes with Ingenuity software. When a gene was assayed by several probe sets, the probe set with the highest variance was used. An unsupervised hierarchical clustering was run on this 459 unique gene list. The normalized expression value for each gene is indicated by a color, with red representing high expression and green representing low expression.
Figure 6
Figure 6. Visualization of gene expression of transcription factors using Amazonia “B cell to plasma cell Atlas”
The gene expression of the 54613 Affymetrix probe sets in MBCs, D4 actBCs, D7 PBs, D10 PCs and BMPCs can be visualized using the Amazonia web site (http://amazonia.transcriptome.eu/). The known interactions of these transcription factors are displayed in A. Data are the expression of genes coding for transcription factors controlling B cell and PC cell fate (B). * indicates that the mean expression is different from that in D0 MBCs, ** from that in D4 actBCs, from that in D7 PBs and # between D10PCs and BMPCs.

References

    1. Allen CD, Okada T, Cyster JG. Germinal-center organization and cellular dynamics. Immunity. 2007;27(2):190–202. - PMC - PubMed
    1. Klein U, Dalla-Favera R. Germinal centres: role in B-cell physiology and malignancy. Nat Rev Immunol. 2008;8(1):22–33. - PubMed
    1. Batista FD, Harwood NE. The who, how and where of antigen presentation to B cells. Nat Rev Immunol. 2009;9(1):15–27. - PubMed
    1. Arce S, Luger E, Muehlinghaus G, et al. CD38 low IgG-secreting cells are precursors of various CD38 high-expressing plasma cell populations. J Leukoc Biol. 2004;75(6):1022–1028. - PubMed
    1. Gonzalez-Garcia I, Rodriguez-Bayona B, Mora-Lopez F, Campos-Caro A, Brieva JA. Increased survival is a selective feature of human circulating antigen-induced plasma cells synthesizing high-affinity antibodies. Blood. 2008;111(2):741–749. - PubMed

Publication types

MeSH terms