. 2010 Jan;24(1):97-104.
doi: 10.1038/leu.2009.217. Epub 2009 Oct 22.

Involvement of RhoH GTPase in the development of B-cell chronic lymphocytic leukemia

Affiliations

Involvement of RhoH GTPase in the development of B-cell chronic lymphocytic leukemia

A Sanchez-Aguilera et al. Leukemia. 2010 Jan.

Abstract

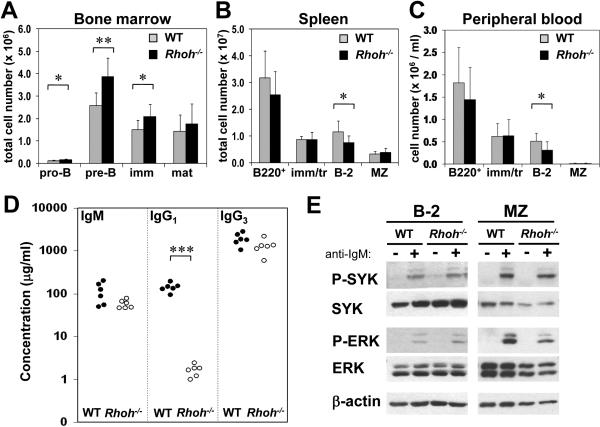
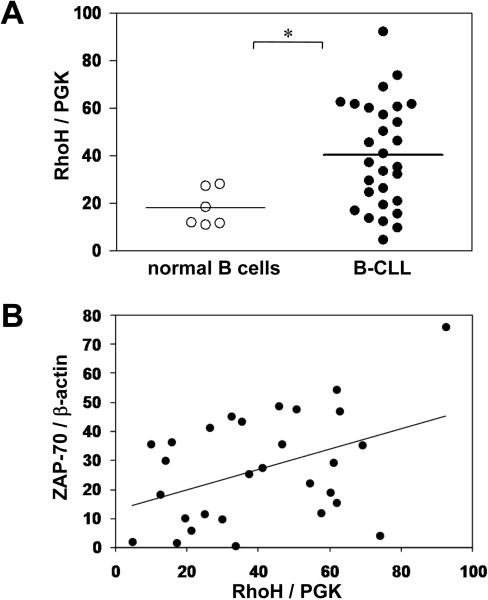
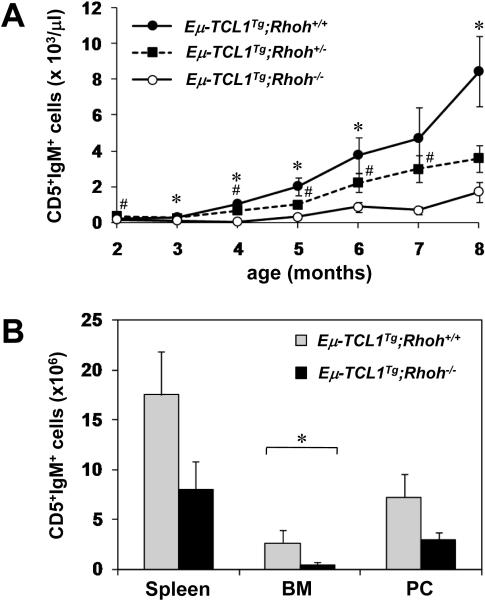
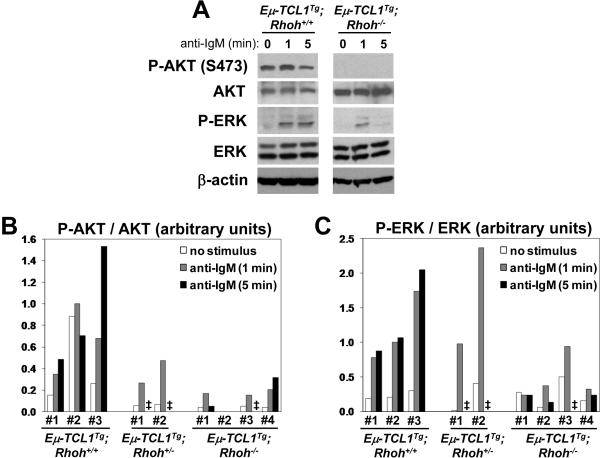
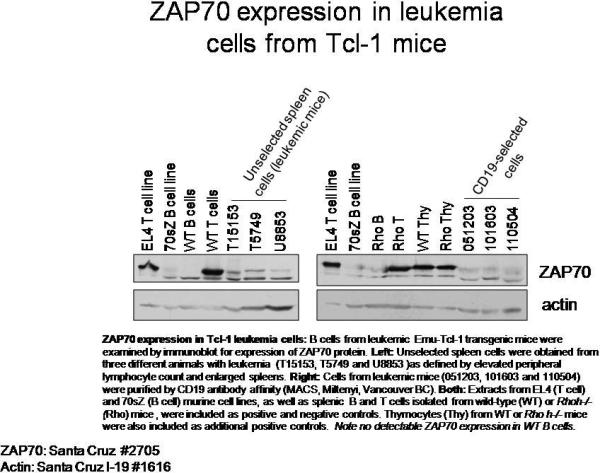
RhoH is a hematopoietic-specific, GTPase-deficient member of the Rho GTPase family that functions as a regulator of thymocyte development and T-cell receptor signaling by facilitating localization of zeta-chain-associated protein kinase 70 (ZAP70) to the immunological synapse. Here we investigated the function of RhoH in the B-cell lineage. B-cell receptor (BCR) signaling was intact in Rhoh(-/-) mice. Because RhoH interacts with ZAP70, which is a prognostic factor in B-cell chronic lymphocytic leukemia (CLL), we analyzed the mRNA levels of RhoH in primary human CLL cells and showed a 2.3-fold higher RhoH expression compared with normal B cells. RhoH expression in CLL positively correlated with the protein levels of ZAP70. Deletion of Rhoh in a murine model of CLL (Emu-TCL1(Tg) mice) significantly delayed the accumulation of CD5(+)IgM(+) leukemic cells in peripheral blood and the leukemic burden in the peritoneal cavity, bone marrow and spleen of Rhoh(-/-) mice compared with their Rhoh(+/+) counterparts. Phosphorylation of AKT and ERK in response to BCR stimulation was notably decreased in Emu-TCL1(Tg);Rhoh(-/-) splenocytes. These data suggest that RhoH has a function in the progression of CLL in a murine model and show RhoH expression is altered in human primary CLL samples.


Figures

Figure 1
Figure 1. B cell subsets in WT and Rhoh−/− mice
Analysis was by multiparameter flow cytometry, and absolute cell numbers were calculated using the total cellularity of each organ. (A) B cell differentiation stages in the bone marrow. (B, C) B cell numbers (B220+) and subsets in the spleen and peripheral blood. Data represent mean ± standard deviation. N=9 mice/analysis. * indicates p<0.05; **, p<0.005. (D) Serum concentrations of IgM, IgG1 and IgG3 in WT and Rhoh−/− mice, determined by ELISA. N=6 mice/genotype. * indicates p<0.001. The differences in IgM and IgG3 were close to statistical significance (p=0.07 and 0.09, respectively. Note logarithmic scale in the y-axis). (E) Analysis of BCR signaling. Sorted populations of B-2 and MZ B cells were stimulated with 25 μg/ml anti-IgM for 1 min and analyzed by immunoblotting for SYK and ERK phosphorylation. WT, wild-type; imm, immature B cells; mat, mature B cells; tr, transitional B cells; MZ, marginal zone B cells.
Figure 2
Figure 2. RhoH expression in human CLL
(A) The ratio of RhoH to PGK1 mRNA levels, measured by quantitative real-time PCR, is shown for primary human CLL cells and for peripheral blood B-cells from healthy donors. Dots represent individual patients. Horizontal bar represents the mean. * indicates p<0.05, normal vs. CLL cells. (B) Correlation between RhoH and ZAP70 expression in primary human CLL cells. ZAP70 protein expression was determined by immunoblotting and the densitometry readout of the ZAP70 bands was normalized with that of β-actin. RhoH mRNA expression was measured by quantitative real-time PCR and normalized with PGK expression. A calibrator sample was used to allow normalization across different PCR plates and western blot membranes. Pearson correlation, r=0.42, p<0.05.
Figure 3
Figure 3. Loss of RhoH delays development of CLL in -TCL1 transgenic mice
(A) RhoH deficiency delays the accumulation of CD5+IgM+ cells over time in peripheral blood of -TCL1 transgenic, Rhoh+/+, Rhoh+/− or Rhoh−/− mice. Data represent mean ± standard error of the mean (SEM). N=5-19 per time point. t-test, * indicates p<0.05 (-TCL1Tg;Rhoh+/+ vs -TCL1Tg/+;Rhoh−/−); #, p<0.05 (-TCL1Tg;Rhoh+/− vs -TCL1Tg;Rhoh−/−). Globally, the three leukemic cell count profiles (-TCL1Tg;Rhoh+/+, Rhoh+/− and Rhoh−/−) over time were significantly different (p < 0.001). All pairwise comparisons were also significantly different: Rhoh+/+ versus Rhoh+/− (p = 0.006), Rhoh+/+ versus Rhoh−/− (p < 0.001), and Rhoh+/− versus Rhoh−/− (p = 0.017). (B) Number of CD5+IgM+ cells in the spleen, bone marrow (BM) and peritoneal cavity (PC) of -TCL1Tg;Rhoh+/+ and -TCL1Tg;Rhoh−/− analyzed at 6 months of age. Data represent mean ± SEM. N=4-7. Differences were statistically significant for BM (*, p < 0.05) and showed a trend in the same direction for spleen (p = 0.11) and peritoneal cavity (p = 0.31).
Figure 4
Figure 4. Impaired BCR-induced AKT phosphorylation in -TCL1Tg;Rhoh−/− splenocytes
(A) Analysis of BCR signaling in splenocytes from -TCL1Tg;Rhoh+/+ and -TCL1Tg;Rhoh−/− mice. Cells were stimulated with 25 μg/ml anti-IgM for 1 or 5 min and analyzed by immunoblotting. (B) Densitometric quantification of AKT (Ser473) phosphorylation in splenocytes from -TCL1Tg;Rhoh+/+ (n=3), -TCL1Tg;Rhoh+/− (n=2) and -TCL1Tg;Rhoh−/− mice (n=4). Values were normalized with total AKT expression. (C) Densitometric quantification of ERK (Thr202/Tyr204) phosphorylation in splenocytes from -TCL1Tg;Rhoh+/+ (n=3), -TCL1Tg;Rhoh+/− (n=2) and -TCL1Tg;Rhoh−/− mice (n=4). Values were normalized with total ERK expression. In (B) and (C), one of the samples was used as a calibrator to allow normalization across different gels. ‡, not determined.
Figure 5
Figure 5

References

    1. Chiorazzi N, Rai KR, Ferrarini M. Chronic lymphocytic leukemia. The New England journal of medicine. 2005 Feb 24;352(8):804–815. - PubMed
    1. Crespo M, Bosch F, Villamor N, Bellosillo B, Colomer D, Rozman M, et al. ZAP-70 expression as a surrogate for immunoglobulin-variable-region mutations in chronic lymphocytic leukemia. The New England journal of medicine. 2003 May 1;348(18):1764–1775. - PubMed
    1. Rassenti LZ, Huynh L, Toy TL, Chen L, Keating MJ, Gribben JG, et al. ZAP-70 compared with immunoglobulin heavy-chain gene mutation status as a predictor of disease progression in chronic lymphocytic leukemia. The New England journal of medicine. 2004 Aug 26;351(9):893–901. - PubMed
    1. Chen L, Widhopf G, Huynh L, Rassenti L, Rai KR, Weiss A, et al. Expression of ZAP-70 is associated with increased B-cell receptor signaling in chronic lymphocytic leukemia. Blood. 2002 Dec 15;100(13):4609–4614. - PubMed
    1. Chen L, Apgar J, Huynh L, Dicker F, Giago-McGahan T, Rassenti L, et al. ZAP-70 directly enhances IgM signaling in chronic lymphocytic leukemia. Blood. 2005 Mar 1;105(5):2036–2041. - PubMed

Publication types

MeSH terms