

Bright field microscopy as an alternative to whole cell fluorescence in automated analysis of macrophage images
- PMID: 19847301
- PMCID: PMC2760782
- DOI: 10.1371/journal.pone.0007497
Bright field microscopy as an alternative to whole cell fluorescence in automated analysis of macrophage images
Abstract
Background: Fluorescence microscopy is the standard tool for detection and analysis of cellular phenomena. This technique, however, has a number of drawbacks such as the limited number of available fluorescent channels in microscopes, overlapping excitation and emission spectra of the stains, and phototoxicity.
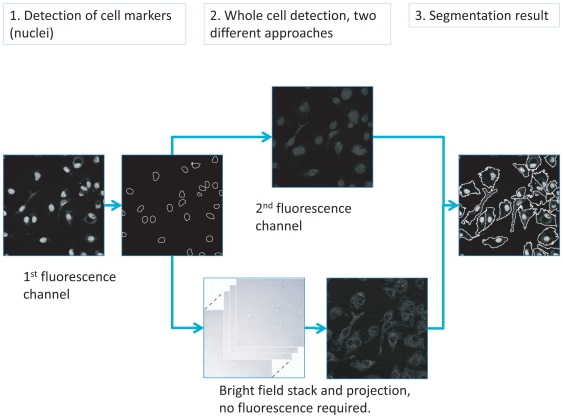
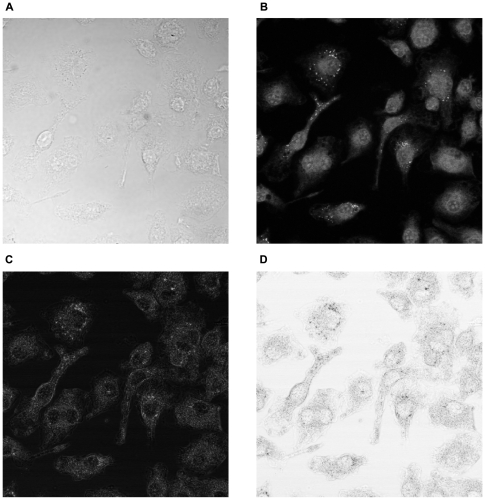
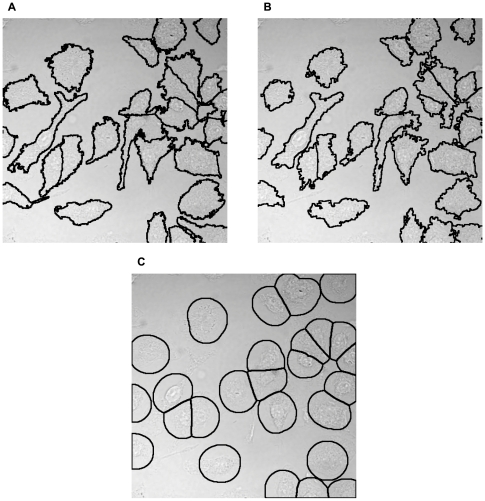
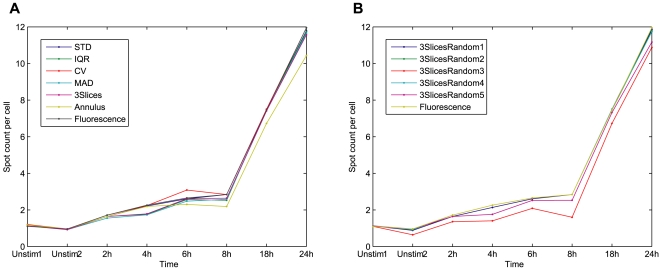
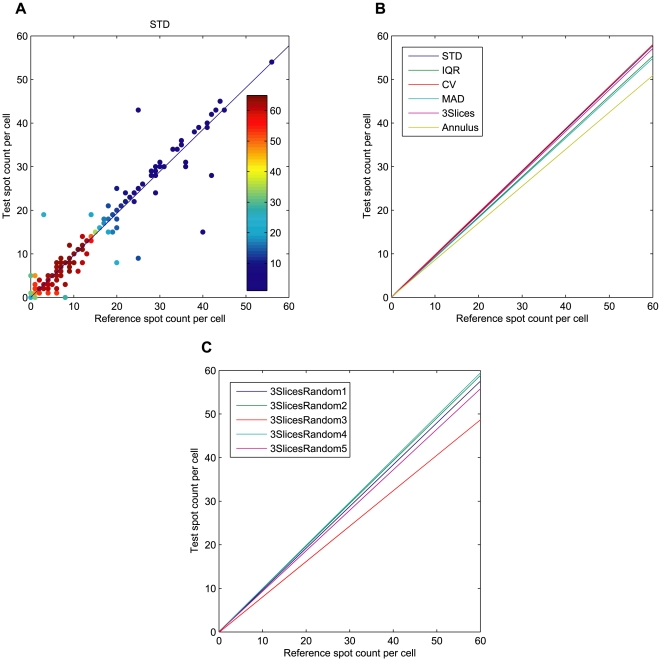
Methodology: We here present and validate a method to automatically detect cell population outlines directly from bright field images. By imaging samples with several focus levels forming a bright field -stack, and by measuring the intensity variations of this stack over the -dimension, we construct a new two dimensional projection image of increased contrast. With additional information for locations of each cell, such as stained nuclei, this bright field projection image can be used instead of whole cell fluorescence to locate borders of individual cells, separating touching cells, and enabling single cell analysis. Using the popular CellProfiler freeware cell image analysis software mainly targeted for fluorescence microscopy, we validate our method by automatically segmenting low contrast and rather complex shaped murine macrophage cells.
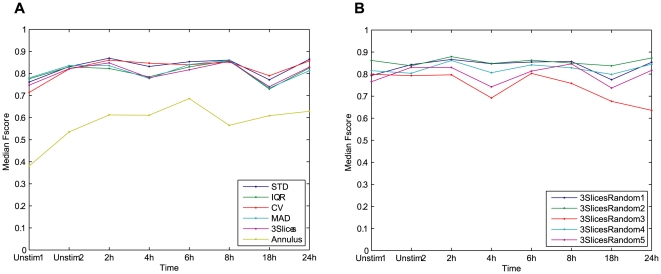
Significance: The proposed approach frees up a fluorescence channel, which can be used for subcellular studies. It also facilitates cell shape measurement in experiments where whole cell fluorescent staining is either not available, or is dependent on a particular experimental condition. We show that whole cell area detection results using our projected bright field images match closely to the standard approach where cell areas are localized using fluorescence, and conclude that the high contrast bright field projection image can directly replace one fluorescent channel in whole cell quantification. Matlab code for calculating the projections can be downloaded from the supplementary site: http://sites.google.com/site/brightfieldorstaining.
Conflict of interest statement
Figures
References
-
- Moffat J, Grueneberg DA, Yang X, Kim SY, Kloepfer AM, et al. A lentiviral RNAi library for human and mouse genes applied to an arrayed viral high-content screen. Cell. 2006;124:1283–1298. - PubMed
-
- Bolte S, Cordelières FP. A guided tour into subcellular colocalization analysis in light microscopy. J Microsc. 2006;224:213–232. - PubMed
-
- Curl CL, Bellair CJ, Harris T, Allman BE, Harris PJ, et al. Refractive index measurement in viable cells using quantitative phase-amplitude microscopy and confocal microscopy. Cytometry A. 2005;65:88–92. - PubMed
-
- Ali R, Gooding M, Christlieb M, Brady M. Advanced phase-based segmentation of multiple cells from brightfield microscopy images. Proc. 5th IEEE International Symposium on Biomedical Imaging: From Nano to Macro ISBI 2008. 2008. pp. 181–184.
Publication types
MeSH terms
Grants and funding
LinkOut - more resources
Full Text Sources
Other Literature Sources
