. 2009 Oct 22;4(10):e7551.
doi: 10.1371/journal.pone.0007551.

Metabolomic profiling in LRRK2-related Parkinson's disease

Affiliations

Metabolomic profiling in LRRK2-related Parkinson's disease

Krisztina K Johansen et al. PLoS One. .

Abstract

Background: Mutations in LRRK2 gene represent the most common known genetic cause of Parkinson's disease (PD).

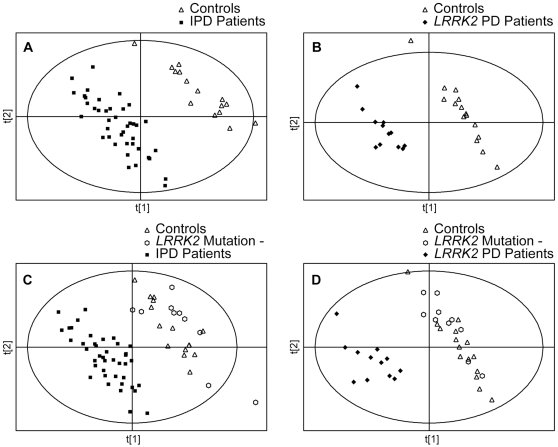
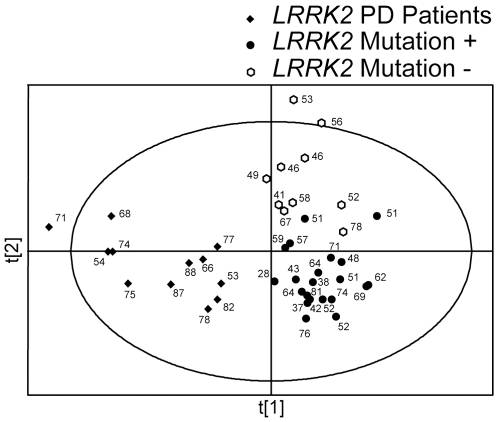
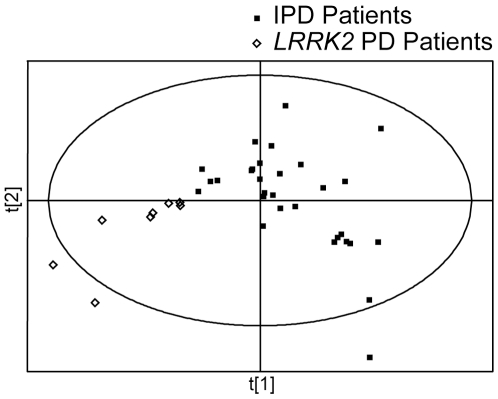
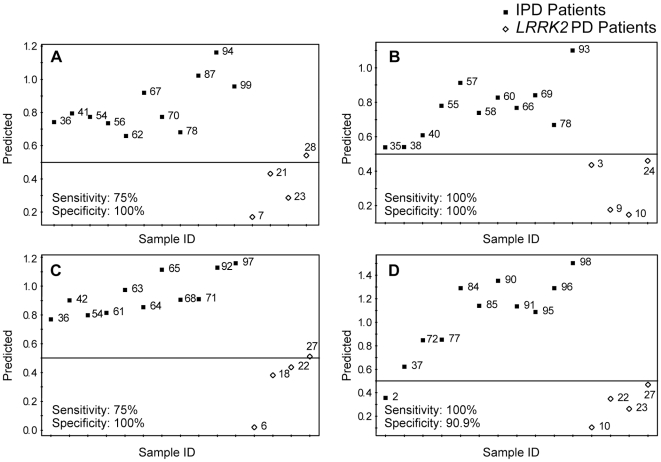
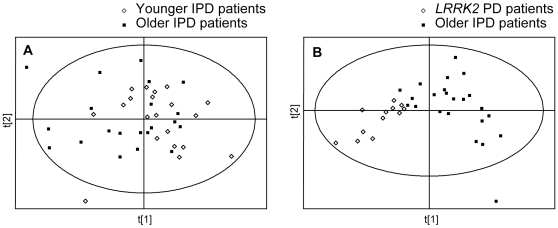
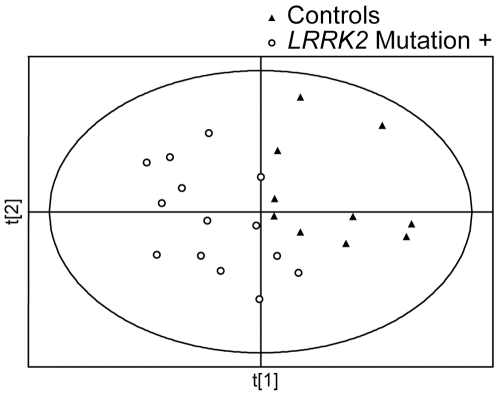
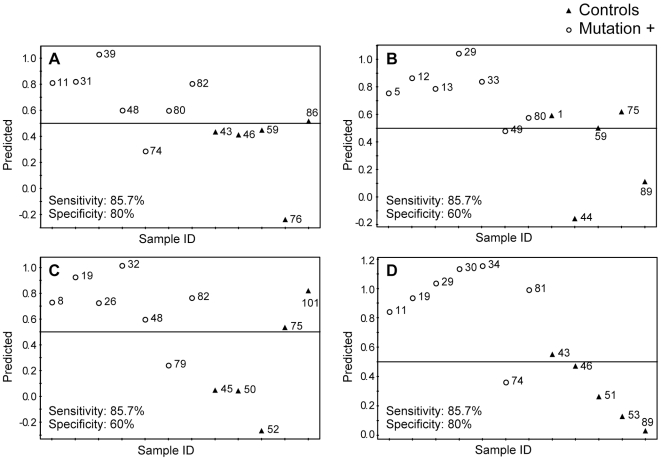
Methodology/principal findings: We used metabolomic profiling to identify biomarkers that are associated with idiopathic and LRRK2 PD. We compared plasma metabolomic profiles of patients with PD due to the G2019S LRRK2 mutation, to asymptomatic family members of these patients either with or without G2019S LRRK2 mutations, and to patients with idiopathic PD, as well as non-related control subjects. We found that metabolomic profiles of both idiopathic PD and LRRK2 PD subjects were clearly separated from controls. LRRK2 PD patients had metabolomic profiles distinguishable from those with idiopathic PD, and the profiles could predict whether the PD was secondary to LRRK2 mutations or idiopathic. Metabolomic profiles of LRRK2 PD patients were well separated from their family members, but there was a slight overlap between family members with and without LRRK2 mutations. Both LRRK2 and idiopathic PD patients showed significantly reduced uric acid levels. We also found a significant decrease in levels of hypoxanthine and in the ratios of major metabolites of the purine pathway in plasma of PD patients.

Conclusions/significance: These findings show that LRRK2 patients with the G2019S mutation have unique metabolomic profiles that distinguish them from patients with idiopathic PD. Furthermore, asymptomatic LRRK2 carriers can be separated from gene negative family members, which raises the possibility that metabolomic profiles could be useful in predicting which LRRK2 carriers will eventually develop PD. The results also suggest that there are aberrations in the purine pathway in PD which may occur upstream from uric acid.


Conflict of interest statement

Competing Interests: The authors have declared that no competing interests exist.

Figures

Figure 1
Figure 1. PLS-DA scores plots of control subjects and PD patients.
PLS-DA scores plots showing a separation between control subjects (n = 15) and idiopathic Parkinson's Disease (IPD) patients (n = 41), and between control subjects (n = 15) and LRRK2 PD patients (n = 12). All peaks (no pre-processing) were used for these analyses. The data from control subjects and from the healthy family members of LRRK2 PD patients without the mutation (n = 10) were used for the analysis either separately (panels A and B), or were combined (panels C and D).
Figure 2
Figure 2. PLS-DA scores plots of LRRK2 PD patients and their family members.
PLS-DA scores plot showing a separation between LRRK2 PD patients (n = 12) and their healthy family member with (n = 21) or without (n = 10) the gene mutation. All peaks (no pre-processing) were used for this analysis. Ages of the individual subjects are shown next to their symbols.
Figure 3
Figure 3. PLS-DA scores plots of IPD and LRRK2 PD patients.
PLS-DA scores plot showing a significant separation between IPD patients (n = 30) and LRRK2 PD patients (n = 8) using preprocessed datasets (see methods for details). Eleven IPD patients and 4 LRRK2 PD patients were randomly chosen as the test set and were not used in PLS-DA model construction. Class membership of the subjects in the test set was then predicted using this PLS-DA model shown in Figure 4.
Figure 4
Figure 4. PLS-DA prediction plots of IPD patients and LRRK2 PD patients.
Twelve analytes (Table 3) were used to build PLS-DA separation model, based on randomly selected 30 IPD and 8 LRRK2 PD patients (a representative plot is shown in Figure 3). The resulting models were used to predict class membership of the remaining 11 IPD and 4 LRRK2 PD patients. This procedure was carried out 4 times with different IPD and LRRK2 PD patients included in the test and training sets each time; the results are presented in panels A–D for all four individual models. Predictions were made with a cutoff of 0.5 for class membership. Numbers next to the symbols refer to the sample codes of the subjects.
Figure 5
Figure 5. Age effects on metabolomic profiles of IPD patients and LRRK2 PD patients.
(A) PLS-DA scores plot showing lack of separation between younger (57.3±5.6 years old, n = 19, mean±SD) and older (71.4±3.3 years old, n = 22, mean±SD) idiopathic PD patients. (B) PLS-DA scores plot showing a significant separation between older idiopathic PD patients (71.4±3.3 years old, n = 22, mean±SD) and LRRK2 patients (72.8±11.2 years old, n = 12, mean±SD). The analytes discriminating between all IPD patients and LRRK2 patients (Figure 4 and Table 3) were used to for the analysis.
Figure 6
Figure 6. PLS-DA score plots of controls and subjects with G2019S LRRK2 gene mutation.
PLS-DA scores plot showing a significant separation between controls (n = 10) and asymptomatic subjects with G2019S LRRK2 gene mutation (n = 14) using preprocessed datasets. Five controls subjects and seven mutation carriers were randomly selected as the test set and were not used in PLS-DA model construction. Class membership of the subjects in the test set was predicted using this PLS-DA model shown in Figure 7.
Figure 7
Figure 7. PLS-DA prediction plots of controls and subjects with G2019S LRRK2 gene mutation.
Nine analytes (Table 4) were used to build PLS-DA separation model, based on randomly selected 10 controls and 14 LRRK2 gene carriers (a representative plot is shown in Figure 6). The resulting models were used to predict class membership of the remaining 5 controls and 7 LRRK2 gene carriers. This procedure was carried out 4 times with different controls and gene carriers included in the test and training sets each time; the results are presented in panels A–D for all four individual models. Predictions were made with a cutoff of 0.5 for class membership. Numbers next to the symbols refer to the sample codes of the subjects.

References

    1. Hardy J, Cai H, Cookson MR, Gwinn-Hardy K, Singleton A. Genetics of Parkinson's disease and parkinsonism. Ann Neurol. 2006;60:389–398. - PubMed
    1. Klein C, Schlossmacher MG. Parkinson disease, 10 years after its genetic revolution: multiple clues to a complex disorder. Neurology. 2007;69:2093–2104. - PubMed
    1. Schiesling C, Kieper N, Seidel K, Kruger R. Review: Familial Parkinson's disease–genetics, clinical phenotype and neuropathology in relation to the common sporadic form of the disease. Neuropathol Appl Neurobiol. 2008;34:255–271. - PubMed
    1. Thomas B, Beal MF. Parkinson's disease. Hum Mol Genet. 2007;16 Spec No. 2:R183–194. - PubMed
    1. Bras JM, Guerreiro RJ, Ribeiro MH, Januario C, Morgadinho A, et al. G2019S dardarin substitution is a common cause of Parkinson's disease in a Portuguese cohort. Mov Disord. 2005;20:1653–1655. - PubMed

Publication types