. 2010 Mar;78(4):825-42.
doi: 10.1002/prot.22608.

A novel and efficient tool for locating and characterizing protein cavities and binding sites

Affiliations

A novel and efficient tool for locating and characterizing protein cavities and binding sites

Ashutosh Tripathi et al. Proteins. 2010 Mar.

Abstract

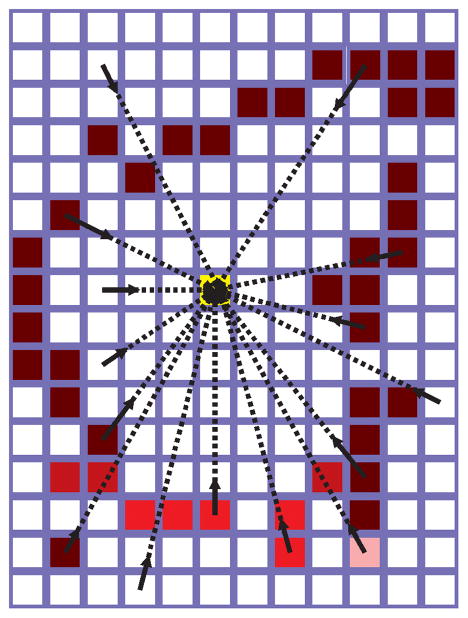
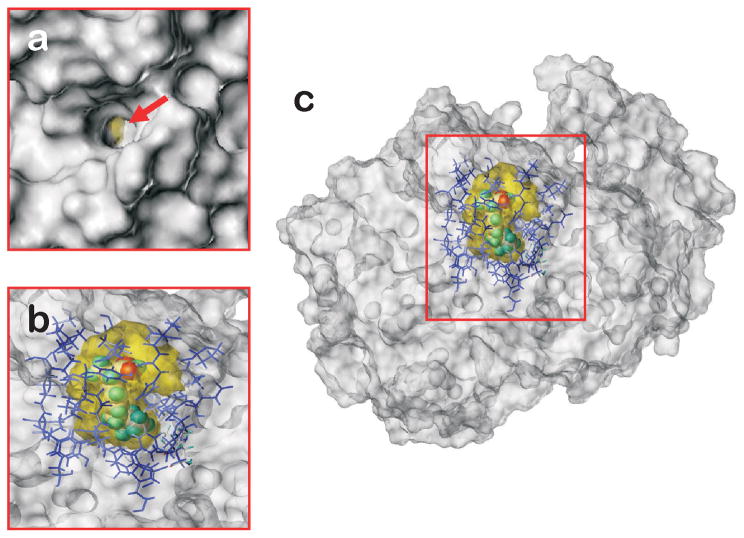
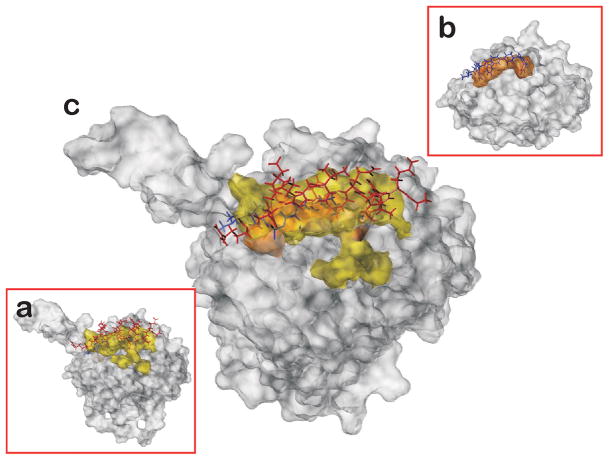
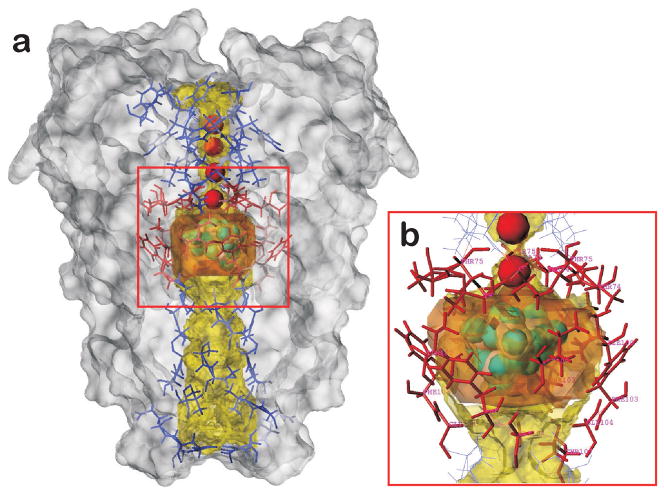
Systematic investigation of a protein and its binding site characteristics are crucial for designing small molecules that modulate protein functions. However, fundamental uncertainties in binding site interactions and insufficient knowledge of the properties of even well-defined binding pockets can make it difficult to design optimal drugs. Herein, we report the development and implementation of a cavity detection algorithm built with HINT toolkit functions that we are naming Vectorial Identification of Cavity Extents (VICE). This very efficient algorithm is based on geometric criteria applied to simple integer grid maps. In testing, we carried out a systematic investigation on a very diverse data set of proteins and protein-protein/protein-polynucleotide complexes for locating and characterizing the indentations, cavities, pockets, grooves, channels, and surface regions. Additionally, we evaluated a curated data set of unbound proteins for which a ligand-bound protein structures are also known; here the VICE algorithm located the actual ligand in the largest cavity in 83% of the cases and in one of the three largest in 90% of the cases. An interactive front-end provides a quick and simple procedure for locating, displaying and manipulating cavities in these structures. Information describing the cavity, including its volume and surface area metrics, and lists of atoms, residues, and/or chains lining the binding pocket, can be easily obtained and analyzed. For example, the relative cross-sectional surface area (to total surface area) of cavity openings in well-enclosed cavities is 0.06 +/- 0.04 and in surface clefts or crevices is 0.25 +/- 0.09. Proteins 2010. (c) 2009 Wiley-Liss, Inc.


Figures

Figure 1
Figure 1. VICE Algorithm
a) Vector representations of direction: red = shell 1, green = shell 2, blue = shell 3; b) Vector (starting in green) continues until reaching grid box edge (red) and all nodes in path (orange shading) are tested; c) Each grid point is surveyed with set of vectors that: are blocked by molecule (black), have clear path to box edge (green), or are stalled (pink) because with their finite length they do not reach box edge and thus are considered as having a clear path. Node 1 is clearly outside the cavity (more clear than blocked paths), node 2 is clearly inside (more blocked than clear), while node 3 is ambiguous requiring further examination with shell 2 vectors; d) The fraction of blocked vectors is represented as a contourable scalar quantity that most impacts the definition of “cavityness” at the mouth; and e) Tendrils, very narrow channels and other vague regions are tested with neighbor count that requires each node to have a minimum number of neighbors defined to be inside the cavity. The nodes indicated in yellow are subject to this filter, which may be applied recursively. Not shown: each closed solid contour must have a minimum volume or it will be deleted.
Figure 2
Figure 2. Cavity Volume Metrics
The volume of the cavity (VC) is indicated by yellow shading, the volume of the ligand (VL) is indicated by vertical green bars, the volume of the ligand occupying the cavity (VO) is the intersection of VC and VL, i.e., yellow shading + green bars. The unoccupied cavity volume is VC − VO, and the volume of the ligand outside the cavity is VL − VO.
Figure 3
Figure 3. Cavity Entrance Calculation
The cavity entrance is calculated from the derivative of the map illustrated in Figure 1d. Vectors are projected from each grid node toward the center-of-gravity of the cavity (dashed lines); the path (as in Figure 1b) is determined and the absolute value of the difference between the starting grid point and the first node on that path is calculated as the derivative. Paths completely inside or outside will have close to zero slope (white), paths clearly crossing from outside to inside will have slope values close to one (dark red), while the ambiguous cavity mouth grid points will have intermediate slope values.
Figure 4
Figure 4. Well-enclosed Cavity
Prostaglandin H2 synthase (1eqg) examined with the VICE algorithm and displayed with MOLCAD and Sybyl. a) The protein Connolly surface is displayed with opaque rendering. The small opening to the cavity is indicated by the red arrow; b) the ligand, ibuprofen rendered in CPK (space-filled), and the residues lining the cavity are shown. The yellow translucent surface illustrates the extents of the cavity. The protein is rendered with a translucent Connolly surface; c) shown as in b) but displaying the entire protein.
Figure 5
Figure 5. Well-enclosed Cavity
IspC (1onp) examined with the VICE algorithm and displayed with MOLCAD and Sybyl. a) The protein Connolly surface is displayed with opaque rendering. The relatively small opening to the cavity can be seen; b) the ligand, the anti-malarial compound fosmidomycin rendered in CPK, and the residues lining the cavity are shown. The yellow translucent surface illustrates the extents of the cavity. The protein is rendered with a translucent Connolly surface and the space-filling magenta sphere is the manganese ion; c) shown as in b) but displaying the entire protein.
Figure 6
Figure 6. Shallow Cavity on Protein Surface
The cytokine interleukin-2 dimer (1m48) has one essentially identical shallow cavity binding site on each of the two chains. a) The inhibitor Ro26-4550 is bound in the cavity of chain A: the cavity extents are displayed as the orange contour volume. Both ends are well-bound but much of the middle of the ligand is external to the cavity; b) both sites are displayed in this view of the entire protein.
Figure 7
Figure 7. Shallow Cavity on Protein Surface
Two structures of the BCL-XL protein with BAK protein and inhibitor ABT-737 bound within its binding cavity. a) BCL-XL protein (1bxl) with sixteen residue BAK protein (red capped stick representation) bound within the surface cavity (yellow translucent envelope); b) BCL-XL protein (2yxj) with ABT-737 inhibitor (blue capped sticks) bound in a relatively smaller sub-pocket (orange translucent surface); c) overlap superposition of 1bxl and 2yxj structures showing the correspondence of the two pockets. Cavity extents illustrated with yellow and orange translucent envelopes.
Figure 8
Figure 8. Cavity at Protein-Protein Interface
a) The tubulin protein (1z2b) with colchicine and vinblastine binding sites at interfaces between the α and β subunits. The tubulin polymer is rendered in ribbon and tube with the α subunits shown in red and β subunits shown in blue; b) inset shows the colchicine binding pocket (yellow contour) at the intra-dimeric interface of the αβ-subunit; c) inset shows the vinblastine binding site (orange contour) at the inter-dimeric interface between αβ-subunits.
Figure 9
Figure 9. Cavity at Protein/Polynucleotide Interface
a) The 30S ribosomal subunit (1fjg) is rendered as ribbon and tube, except within 20 Å of binding region where a MOLCAD surface display is shown to highlight the binding pockets for the antibiotics spectinomycin, paromomycin and streptomycin; b) the binding site for paromomycin (orange envelope) and streptomycin (yellow envelope) are illustrated. The antibiotic drugs are rendered in spacefill; c) the binding pocket for spectinomycin (yellow envelope) is illustrated.
Figure 10
Figure 10. Flexible Cavity with Loop or Domain Movement
The citrate synthase protein, 5cts (red) and 5csc (blue), the apo (unliganded) and holo (ligand-bound) forms, respectively, is illustrated. A relatively smaller binding pocket is detected in 5cts (orange envelope); however, the native ligand oxaloacetate (green capped sticks) induces a domain movement that significantly alters the shape and size of the binding pocket (yellow envelope) in 5csc.
Figure 11
Figure 11. Channels and Tunnels
a) The KscA K+ ion channel (1j95) plotted with translucent MOLCAD surface. The binding pocket at the center of the channel is illustrated with an orange contour map; its tetrabutylammonium inhibitor is rendered in CPK (space-fill). The channel, traversing the entire length of the protein, is highlighted with the yellow contour map. Detection of the channel required calculations with a very large number of grid map points and high resolution. The potassium ions are rendered as the red spheres; b) expanded view of the inhibitor binding cavity.
Figure 12
Figure 12. Auxiliary and allosteric sites
The glycogen phosphorylase b (1c50) with multiple binding pockets. a) A close-up view of the allosteric/auxiliary site. The AMP cofactor (red sticks, green cavity contour) and allosteric site (yellow contour) with inhibitor CP320626 (blue sticks) are in separate subsites of the overall surface groove (orange contour); b) the main catalytic site (cyan contour) is bound with PLP and is quite deeply buried in the protein.

References

    1. Sotriffer C, Klebe G. Identification and mapping of small-molecule binding sites in proteins: computational tools for structure-based drug design. Il Farmaco. 2002;57:243–251. - PubMed
    1. Berman HM, Westbrook J, Feng Z, Gilliland G, Bhat TN, Weissig H, Shindyalov IN, Bourne PE. The protein data bank. Nucl Acids Res. 2000;28:235–242. - PMC - PubMed
    1. Campbell SJ, Gold ND, Jackson RM, Westhead DR. Ligand binding: functional site location, similarity and docking. Curr Opin Struct Biol. 2003;13:389–395. - PubMed
    1. Pazos F, Sternberg MJE. Automated prediction of protein function and detection of functional sites from structure. Proc Natl Acad Sci. 2004;101:14754–14759. - PMC - PubMed
    1. Kleywegt GJ. Detection, delineation, measurement and display of cavities in macromolecular structures. Acta Crystallogr D. 1994;50:178–185. - PubMed

Publication types

LinkOut - more resources