. 2009 Oct;32(10):1273-84.
doi: 10.1093/sleep/32.10.1273.

Sleep-dependent improvement in visuomotor learning: a causal role for slow waves

Affiliations

Sleep-dependent improvement in visuomotor learning: a causal role for slow waves

Eric C Landsness et al. Sleep. 2009 Oct.

Abstract

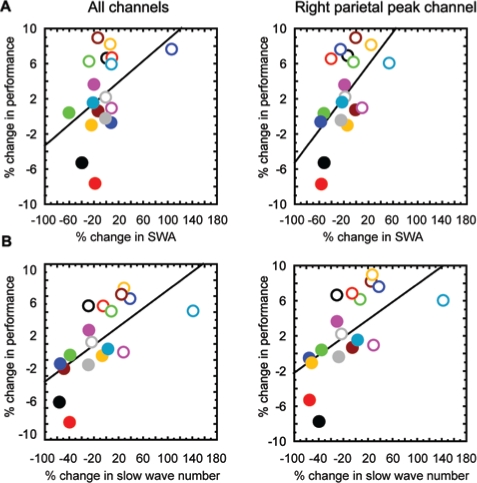
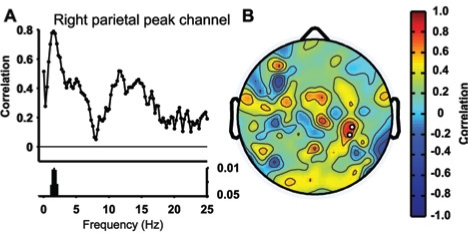
Study objectives: Sleep after learning often benefits memory consolidation, but the underlying mechanisms remain unclear. In previous studies, we found that learning a visuomotor task is followed by an increase in sleep slow wave activity (SWA, the electroencephalographic [EEG] power density between 0.5 and 4.5 Hz during non-rapid eye movement sleep) over the right parietal cortex. The SWA increase correlates with the postsleep improvement in visuomotor performance, suggesting that SWA may be causally responsible for the consolidation of visuomotor learning. Here, we tested this hypothesis by studying the effects of slow wave deprivation (SWD).

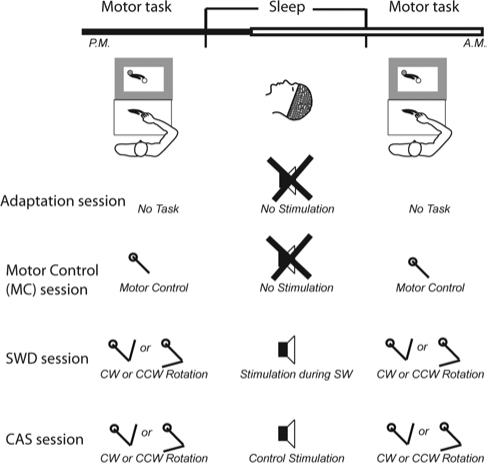
Design: After learning the task, subjects went to sleep, and acoustic stimuli were timed either to suppress slow waves (SWD) or to interfere as little as possible with spontaneous slow waves (control acoustic stimulation, CAS).

Setting: Sound-attenuated research room.

Participants: Healthy subjects (mean age 24.6 +/- 1.0 years; n = 9 for EEG analysis, n = 12 for behavior analysis; 3 women).

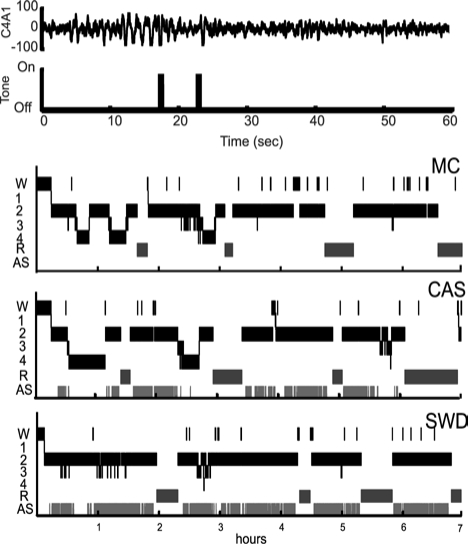
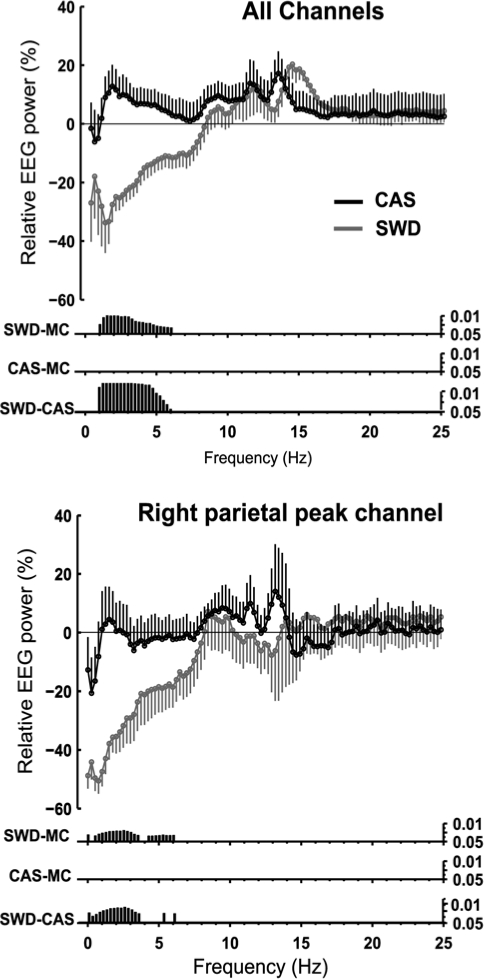
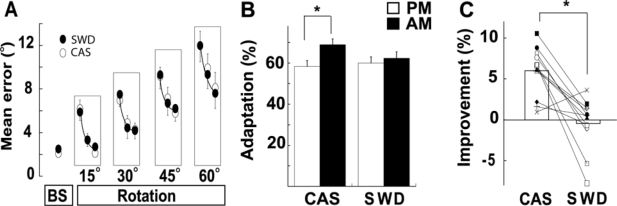
Measurements and results: Sleep time and efficiency were not affected, whereas SWA and the number of slow waves decreased in SWD relative to CAS. Relative to the night before, visuomotor performance significantly improved in the CAS condition (+5.93% +/- 0.88%) but not in the SWD condition (-0.77% +/- 1.16%), and the direct CAS vs SWD comparison showed a significant difference (P = 0.0007, n = 12, paired t test). Changes in visuomotor performance after SWD were correlated with SWA changes over right parietal cortex but not with the number of arousals identified using clinically established criteria, nor with any sign of "EEG lightening" identified using a novel automatic method based on event-related spectral perturbation analysis.

Conclusion: These results support a causal role for sleep slow waves in sleep-dependent improvement of visuomotor performance.


Figures

Figure 1
Figure 1
Study Design. The study consisted of 4 conditions, spaced ~ 1 week apart and in randomized order. The motor control (MC) task involves the same number of movements as the rotation adaptation task, but no rotation adaptation occurs. SWD refers to slow wave deprivation; CAS control acoustic stimulation; CW, clockwise; CCW, counterclockwise.
Figure 2
Figure 2
Representative electroencephalographic traces and hypnograms. Top trace shows when two, 1-second duration tones at ~ 85 dB caused the subject to transition into a lighter stage of sleep. Bottom shows representative hypnograms for motor control (MC), control acoustic stimulation (CAS), and slow wave deprivation (SWD) conditions; W, waking; R, rapid eye movement sleep; 1-4: non-rapid eye movement sleep stages 1-4; AS, time of acoustic stimulation.
Figure 3
Figure 3
All-night changes in non-rapid eye movement (NREM) electroencephalographic (EEG) power spectrum for control acoustic stimulation (CAS) and slow wave deprivation (SWD) relative to motor control (MC) (0 line) for all channels (top) and for a single channel (bottom) over right parietal cortex. Black bars indicate frequency bins for which EEG power was significantly different between conditions (mean ± SEM, n = 9, paired t test).
Figure 4
Figure 4
Topographic distribution of slow wave activity (SWA) during non-rapid eye movement (NREM) sleep in motor control (MC), slow wave deprivation (SWD), and control acoustic stimulation (CAS). Top, average NREM SWA for the entire night (n = 9). Color bar values represent the absolute electroencephalographic power (μV2/0.25-Hz frequency bin) averaged for the 0.5-4.5 Hz range. Values were plotted at the corresponding position on the planar projection of the scalp surface, and interpolated (biharmonic spline) between electrodes (dots) using EEGLAB. Bottom: Topographic distribution of the slow wave activity in the SWD condition, expressed as the percentage difference relative to MC or CAS for the entire night.
Figure 5
Figure 5
Time course of slow wave activity (SWA) across the night. Electroencephalographic power density for channel Fz in the 0.5- to 4.5-Hz range (n = 9, mean ± SEM) for motor control (MC), control acoustic stimulation (CAS), and slow wave deprivation (SWD). SWA values expressed as percentage of the mean SWA across the entire night in the MC condition. To account for interindividual variations in non-rapid eye movement (NREM) /rapid eye movement (REM) cycle duration, NREM episodes were subdivided into 40 bins of equal duration (percentiles), and REM episodes into 10 percentiles.
Figure 6
Figure 6
Behavior changes. (A) Learning curves for the rotation adaptation task for the control acoustic stimulation (CAS) and slow wave deprivation (SWD) conditions in the evening. The mean directional error for each block of 90 movements is plotted. Points are means across subjects and bars represent standard errors (n = 12). (B) Amount of adaptation for CAS and SWD. Mean directional error was tested in the evening at the end of training using an imposed rotation of 60°. Subjects were then retested with the same imposed rotation of 60° in the morning. Adaptation computed as a percentage with the formula: 100 *(1-[mean directional error / 60°]) represents the amount to which the subject was able to adapt to an imposed rotation (n = 12, mean ± SEM). (C) Change in individual postsleep visuomotor performance on rotation-adaptation task. Values represent percentage of improvement in mean directional error upon retesting the next morning relative to testing the previous evening (n = 12, mean ± SEM, paired t test, P = 0.0007)
Figure 7
Figure 7
Relationship between sleep parameters and postsleep performance. (A) Relationship between change in slow wave activity (SWA) (% of motor control [MC]) and change in postsleep visuomotor performance for all channels and a single channel over right parietal cortex. Each subject is represented by a different color (filled symbols: slow wave deprivation [SWD]; empty symbols: control acoustic stimulation [CAS]). Solid lines indicate a regression line. (B) Relationship between the change in number of slow waves (% of MC) and change in postsleep visuomotor performance for all channels and a single channel over right parietal cortex.
Figure 8
Figure 8
Correlation between performance and electroencephalographic (EEG) power. (A) Correlation between EEG power (0.25 Hz bins; normalized to motor control [MC]) and visuomotor performance change during slow wave deprivation (SWD) for a single channel over right parietal cortex. Black bars indicate frequency bins with significant correlation (n = 9, P < 0.05, paired t test). (B) Topographic distribution of the correlation between SWA (normalized to MC) and visuomotor performance changes after SWD. White dots represent electrodes that were significantly correlated (n = 9, P < 0.05, pairedt test). Values were plotted at the corresponding position on the planar projection of the scalp surface, and interpolated (biharmonic spline) between electrodes using EEGLAB.
Figure 9
Figure 9
Event-related spectral perturbation (ERSP) analysis for slow wave deprivation (SWD) and control acoustic stimulation (CAS). (A) Representative ERSP plots obtained from 3 representative subjects. Left panel shows a pilot night when tones were played to induce a behavioral arousal. (B) Mean change in electroencephalographic (EEG) power (n = 9) 0-7 seconds after the delivery of the tone (vertical dashed lines) for SWD and CAS. Right panel shows significant differences in ERSP between the 2 conditions (P < 0.02, 2-tailed bootstrap EEGLAB).
Supplementary Figure 1
Topographic distribution of spindle power during non-rapid eye movement (NREM) sleep in motor control (MC), slow wave deprivation (SWD), and control acoustic stimulation (CAS). Top, average NREM spindle (12- to 15-Hz) power for the entire night (n = 9). Color bar values represent the absolute EEG power (μV2/0.25-Hz frequency bin) averaged for the 12- to 15-Hz range. Values were plotted at the corresponding position on the planar projection of the scalp surface, and interpolated (biharmonic spline) between electrodes (dots) using EEGLAB. Bottom: Topographic distribution of the spindle power in SWD expressed as a percentage of MC or CAS for the entire night.
Supplementary Figure 2
Clustering of the event-related spectral perturbation (ERSP) response to a tone (A) in control acoustic stimulation (CAS) and slow wave deprivation (SWD) as a projection of a 5-dimensional space (7641 tones, 16 unique clusters). The 4 red clusters on the right contain 72.2% of all tones that led to an arousal as clinically defined. Line width and color represent the distance between clusters. (B) Distribution of clusters. Mean number (± SEM) of tones per cluster in CAS and SWD. Hashed bars represent clusters that contained 72.2% of all arousals in response to a tone. Clusters 11 and 15 were significantly different between conditions (P < 0.05, n = 9, t test).

Comment in

References

    1. Born J, Rasch B, Gais S. Sleep to remember. Neuroscientist. 2006;12:410–424. - PubMed
    1. Giuditta A, Ambrosini MV, Montagnese P, et al. The sequential hypothesis of the function of sleep. Behav Brain Res. 1995;69:157–66. - PubMed
    1. Stickgold R, Whidbee D, Schirmer B, Patel V, Hobson JA. Visual discrimination task improvement: A multi-step process occurring during sleep. J Cogn Neurosci. 2000;12:246–54. - PubMed
    1. Plihal W, Born J. Effects of early and late nocturnal sleep on declarative and procedural memory. J Cogn Neurosci. 1997;9:534–47. - PubMed
    1. Steriade M. The corticothalamic system in sleep. Front Biosci. 2003;8:D878–99. - PubMed

Publication types