. 2010 Jan;50(1):72-87.
doi: 10.1016/j.visres.2009.10.012.

The influence of intrinsically-photosensitive retinal ganglion cells on the spectral sensitivity and response dynamics of the human pupillary light reflex

Affiliations

The influence of intrinsically-photosensitive retinal ganglion cells on the spectral sensitivity and response dynamics of the human pupillary light reflex

David H McDougal et al. Vision Res. 2010 Jan.

Abstract

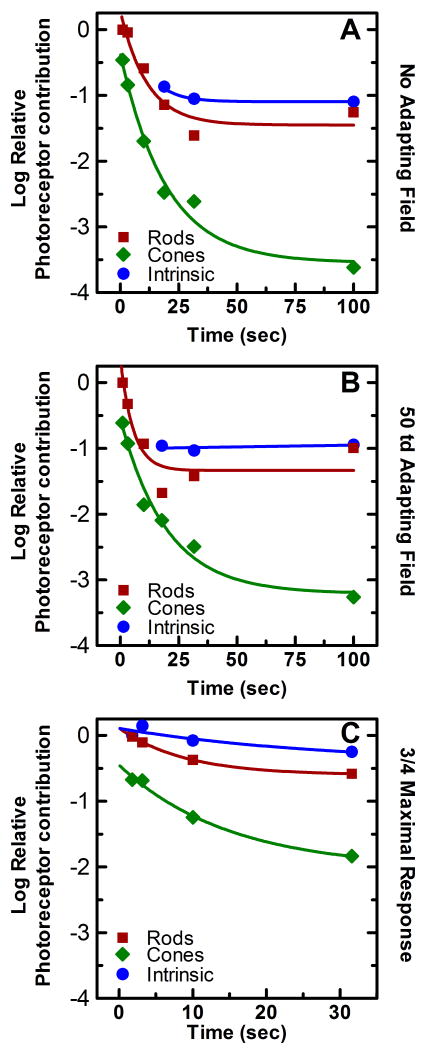
Historically, it was assumed that the light-evoked neural signals driving the human pupillary light reflex (PLR) originated exclusively from rod and cone photoreceptors. However, a novel melanopsin-containing photoreceptive cell class has recently been discovered in the mammalian retina. These intrinsically-photosensitive retinal ganglion cells (ipRGCs) project to the pretectum, the retinorecipient area of the brain responsible for the PLR. This study was therefore designed to examine the relative contribution of rod, cone and the melanopsin photoresponses of ipRGCs to the human PLR. We establish that the melanopsin photoresponse of ipRGCs contributes significantly to the maintenance of half maximal pupilloconstriction in response to light stimuli of 30s or longer, even at low photopic irradiances. Furthermore, we show that the melanopsin photoresponse contributes significantly to three-quarter maximal pupilloconstriction in response to light stimuli as short as 2s. We also demonstrate that cone photoresponses driving pupilloconstriction adapt considerably and contribute little after 30s, but rod photoresponses adapt less and contribute significantly to the maintenance of pupilloconstriction in response to steady-state light stimuli at irradiance levels which are below the threshold of the melanopsin photoresponse.


Figures

Figure 1
Figure 1
Average pupillary light responses to three different monochromatic light stimuli, 450 nm (blue trace), 530 nm (green trace), and 610 nm (red trace) necessary to produce approximately a half-maximal pupillary constriction at (A) 1 second, (B) 3.16 seconds, (C) 10 seconds, (D) 31.6 seconds, and (E) 100 seconds (n=6). The black bar in the upper right hand corner of each panel indicates the measurement interval utilized in each of the five duration conditions. Note the increase in the disparity of the initial response to each of the three wavelengths as stimulus duration is increased.
Figure 2
Figure 2
Illustration of the effect of changing the curve fitting parameters of equation (4) on the composite spectral sensitivity derived from the combination of rod and cone spectral sensitivities. Panels A, C, and E demonstrate the effect of changing the value of the parameter k in equation (4) to 1 (A), 2 (C), and 100 (E). Panels B, D, and F demonstrate the effect of changing the relative contribution of the rod and cone signals on the spectral sensitivity of the overlying function, by setting c = 0.5r (B), c = 0.1r (D), and c = 0.03r (F).
Figure 3
Figure 3
Optimization of the combination parameters of equation (8) for inner and outer retinal signals. The average effect on the deviation of the composite spectral sensitivity function from the measured average spectral sensitivity data as (A) the value of k1 is increased from 1 to 10 (n=4); (B) The value of k2 is increased from 1 to 30 (n=6). Only spectral sensitivity data at duration and experimental conditions which clearly were not influenced by the melanopsin photoresponse, i.e., short duration, half maximal responses, were used to optimize k1. For the optimization of k2, the value of k1 was set at 1, and spectral sensitivity data were used only at duration and experimental conditions at which the melanopsin photoresponse was clearly influencing composite spectral sensitivity.
Figure 4
Figure 4
Spectral sensitivity of half-maximal pupillary constriction with no adapting field present. Mean spectral sensitivity measurements (n=3) at nine different wavelengths are represented by (○) for six different stimulus duration conditions, (A) 1 second, (B) 3.16 seconds, (C) 10 seconds, (D) 17.8 seconds, (E) 31.6 seconds, and (F) 100 seconds (In this and subsequent figures, error bars are SEM, and are smaller than symbol size when not shown). The left y-axis represents the log spectral sensitivity relative to the most sensitive wavelength at each duration condition. The right y-axis indicates the retinal irradiance necessary to produce the criterion response. The smooth curve through the data points represents the optimal fit to the data using equation (8), a mathematical combination of rod, cone, and melanopsin spectral sensitivities based on the Quick pooling model of visual sensitivity (see Methods and table 1 for details).
Figure 5
Figure 5
Spectral sensitivity of half-maximal pupillary constriction with a 50 troland adapting field present. Mean spectral sensitivity measurements (n=5) at ten different wavelengths are represented by (○) for six different stimulus duration conditions, (A) 1 second, (B) 3.16 seconds, (C) 10 seconds, (D) 17.8 seconds, (E) 31.6 seconds, and (F) 100 seconds (SEM error bars). The left y-axis represents the log spectral sensitivity relative to the most sensitive wavelength at each duration condition. The right y-axis indicates the retinal irradiance necessary to produce the criterion response. The smooth curve through the data points represents the optimal fit to the data using equation (8), a mathematical combination of rod, cone, and melanopsin spectral sensitivities based on the Quick pooling model of visual sensitivity (see Methods and table 2 for details).
Figure 6
Figure 6
Spectral sensitivity of three quarter-maximal pupillary constriction with a 50 td adapting field present. Mean spectral sensitivity measurements (n=3) at ten different wavelengths are represented by (○) for four different stimulus duration conditions, (A) 1.78 seconds, (B) 3.16 seconds, (C) 10 seconds, and (D) 31.6 seconds (SEM error bars). The left y-axis represents the log spectral sensitivity relative to the most sensitive wavelength at each duration condition. The right y-axis indicates the retinal irradiance necessary to produce the criterion response. The smooth curve through the data points represents the optimal fit to the data using equation (8), a mathematical combination of rod, cone, and melanopsin spectral sensitivities based on the Quick pooling model of visual sensitivity (see Methods and table 3 for details).
Figure 7
Figure 7
Relative contribution of the rod, cone, and melanopsin photoresponse to the spectral sensitivity of the PLR over time. The time course of light adaptation of the rod (■), cone (◆), and melanopsin (●) photoresponses while maintaining a half maximal PLR with (A) no background present, (B) a 50 td adapting background, and (C) a three quarter maximal PLR with a 50 td adapting background. Light adaptation was calculated by the combining the difference in absolute irradiance necessary to maintain these responses with the change in relative contribution of each of the photoresponses to the composite spectral sensitivity function generated for each duration condition of each of the three experiments (see section 2.4 for details). Each point is relative to the most sensitive photoresponse at the shortest duration condition. The smooth line through each data set is the best fit of a three parameter single exponential decay function to the data. The decay parameters and R2 values for each curve are reported in table 4.
Figure 8
Figure 8
The effect of intraocular light scatter on the rod contribution to our spectral sensitivity measurements. In order to ascertain whether intraocular light scatter may have affected the calculated contribution of the rod photoresponse to our composite spectral sensitivity function, we calculated the actual stimulus profile striking the retina given our 36 degree stimulus and the effect of intraocular light scatter as specified in CIE collection 135-1999. Panel A is a two-dimensional representation of the actual stimulus profile impinging on the retina and demonstrates the attenuation of our light stimulus for retinal eccentricities greater that +/- 18 degrees from the central fixation. Panel B shows the average pupillary light response over time (n=6) of subject A to an annulus (36°-140 °) which matched the irradiance profile of the light scatter produced by the stimulus used to produce a half maximal PLR in subject A during experiment 1. Note that within 30 seconds of light onset the subject shows no increase in pupilloconstriction over that measured during the baseline measurement interval ten seconds prior to stimulus onset.
Figure 9
Figure 9
Comparison of the steady-state spectral sensitivities of the current study with previous studies. (A) Our data (formula image
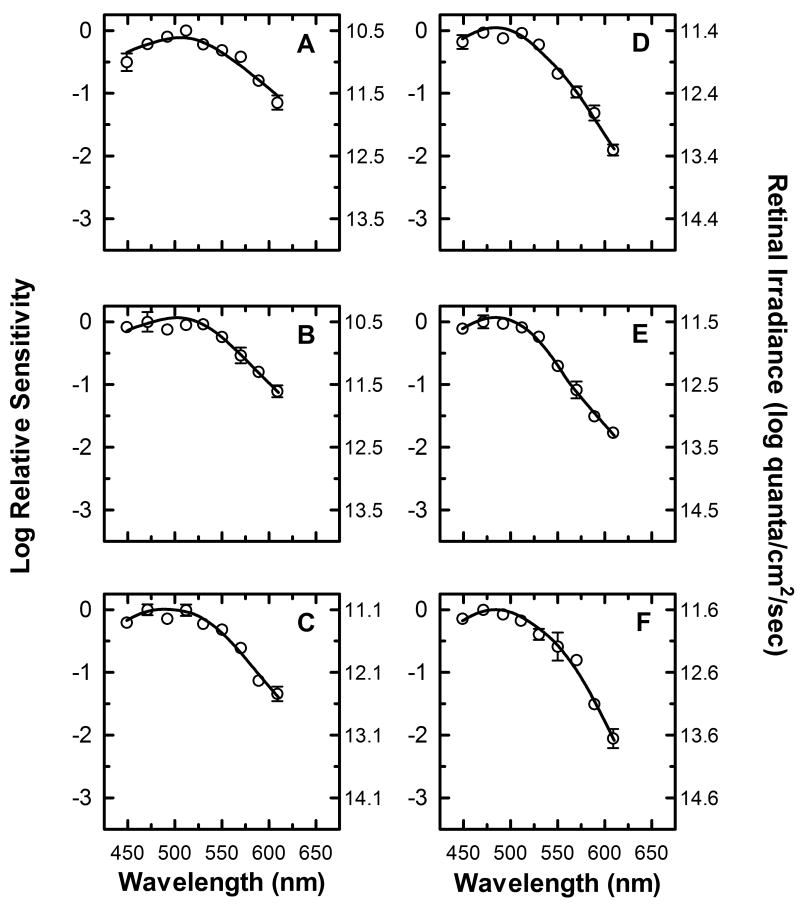
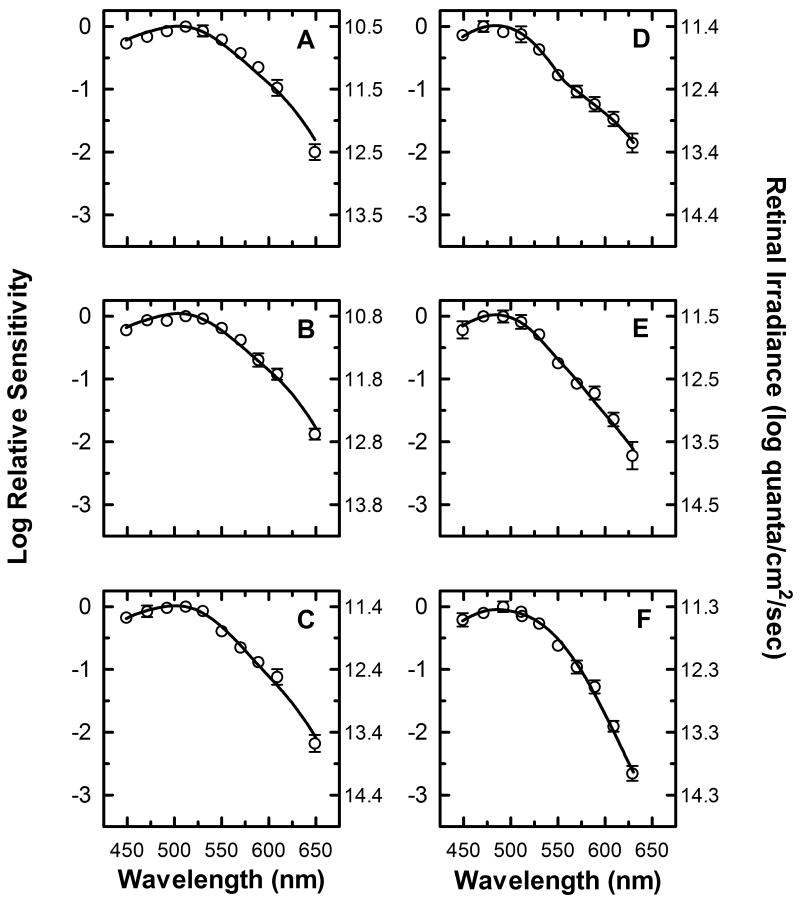
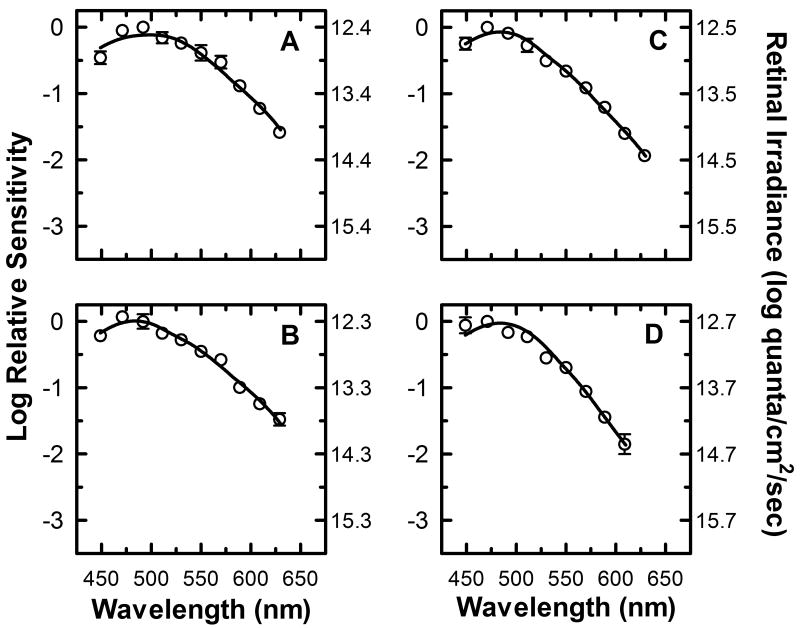
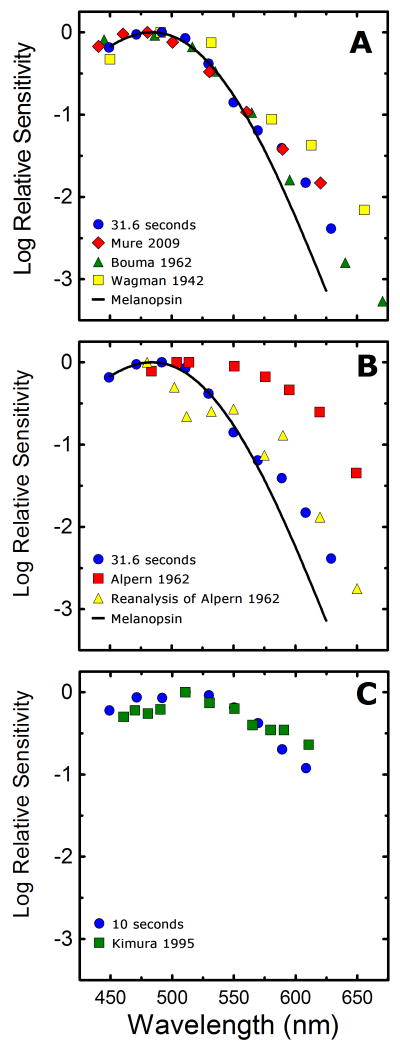
) shows good concordance with previous reports by Mure 2009 (formula image), Bouma 1962 (formula image), and Wagman 1942 (formula image) of the spectral sensitivity of the human PLR in response to steady-state light stimuli. Conversely, (B) Our data (formula image) is not in agreement with the report by Alpern 1962 (formula image) of the spectral sensitivity of steady-state PLR. However, when the data of Alpern 1962 is reanalyzed to correct for possible errors produced by incorrect baseline measurements (formula image) (see section 4.6 for details), the results are similar to the results of the current study. (C) Our measured spectral sensitivity of the PLR for shorter stimulus durations (formula image) is also in good concordance with the spectral sensitivity measured by Kimura 1995 (formula image) for similar stimulus durations. All previously reported data were converted from corneal illuminance to retinal irradiance when necessary in order to facilitate the comparisons between studies. In panels A and B, the absorbance spectrum of melanopsin is represented by a Baylor nomogram (Baylor et al., 1987) with a lambda max at 483 nm.

References

    1. Adelson EH. Saturation and adaptation in the rod system. Vision Research. 1982;22(10):1299–1312. - PubMed
    1. Aggelopoulos N, Meissl H. Responses of neurones of the rat suprachiasmatic nucleus to retinal illumination under photopic and scotopic conditions. J Physiol. 2000;523(Pt 1):211–222. - PMC - PubMed
    1. Alpern M, Campbell FW. The spectral sensitivity of the consensual light reflex. J Physiol. 1962;164:478–507. - PMC - PubMed
    1. Alpern M, Falls HF, Lee GB. The enigma of typical total monochromacy. Am J Ophthalmol. 1960;50:996–1012. - PubMed
    1. Alpern M, Ohba N. The effect of bleaching and backgrounds on pupil size. Vision Res. 1972;12(5):943–951. - PubMed

Publication types