

Negative covariation between task-related responses in alpha/beta-band activity and BOLD in human sensorimotor cortex: an EEG and fMRI study of motor imagery and movements
- PMID: 19850134
- PMCID: PMC2818527
- DOI: 10.1016/j.neuroimage.2009.10.028
Negative covariation between task-related responses in alpha/beta-band activity and BOLD in human sensorimotor cortex: an EEG and fMRI study of motor imagery and movements
Abstract
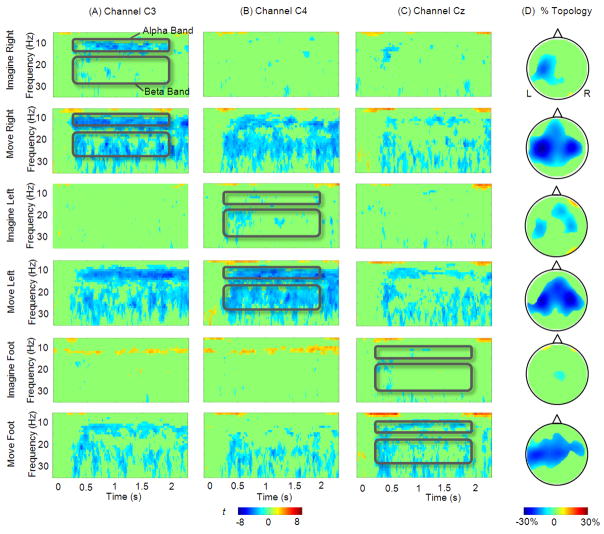
Similar to the occipital alpha rhythm, electroencephalographic (EEG) signals in the alpha- and beta-frequency bands can be suppressed by movement or motor imagery and have thus been thought to represent the "idling state" of the sensorimotor cortex. A negative correlation between spontaneous alpha EEG and blood-oxygen-level-dependent (BOLD) signals has been reported in combined EEG and fMRI (functional Magnetic Resonance Imaging) experiments when subjects stayed at the resting state or alternated between the resting state and a task. However, the precise nature of the task-induced alpha modulation remains elusive. It was not clear whether alpha/beta rhythm suppressions may co-vary with BOLD when conducting tasks involving varying activations of the cortex. Here, we quantified the task-evoked responses of BOLD and alpha/beta-band power of EEG directly in the cortical source domain, by using source imaging technology, and examined their covariation across task conditions in a mixed block and event-related design. In this study, 13 subjects performed tasks of right-hand, right-foot or left-hand movement and motor imagery when EEG and fMRI data were separately collected. Task-induced increase of BOLD signal and decrease of EEG amplitudes in alpha and beta bands were shown to be co-localized at the somatotopic sensorimotor cortex. At the corresponding regions, the reciprocal changes of the two signals co-varied in the magnitudes across imagination and movement conditions. The spatial correspondence and negative covariation between the two measurements were further shown to exist at somatotopic brain regions associated with different body parts. These results suggest an inverse functional coupling relationship between task-induced changes of BOLD and low-frequency EEG signals.
Copyright (c) 2009 Elsevier Inc. All rights reserved.
Figures


References
-
- Berger H. Uber das Elektroenkephalogramm des Menschen. Arch Psychiatr Nervenkr. 1929;87:527–570.
-
- Brookes MJ, Gibson AM, Hall SD, Furlong PL, Barnes GR, Hillebrand A, Singh KD, Holliday IE, Francis ST, Morris PG. GLM-beamformer method demonstrates stationary field, alpha ERD and gamma ERS co-localisation with fMRI BOLD response in visual cortex. NeuroImage. 2005;26:302–308. - PubMed
-
- Babiloni C, Carducci F, Cincotti F, Rossini PM, Neuper C, Pfurtscheller G, Babiloni F. Human movement-related potentials vs desynchronization of EEG alpha rhythm: a high-resolution EEG study. Neuroimage. 1999;10:658–665. - PubMed
-
- Babiloni F, Cincotti F, Babiloni C, Carducci F, Mattia D, Astolfi L, Basilisco A, Rossini PM, Ding L, Ni Y, Cheng J, Christine K, Sweeney J, He B. Estimation of the cortical functional connectivity with the multimodal integration of high-resolution EEG and fMRI data by directed transfer function. Neuroimage. 2005;24:118–131. - PubMed
-
- Crone NE, Miglioretti DL, Gordon B, Lesser RP. Functional mapping of human sensorimotor cortex with electrocorticographic spectral analysis. II. event-related synchronization in the gamma band. Brain. 1998a;121:2301–2315. - PubMed
Publication types
MeSH terms
Grants and funding
LinkOut - more resources
Full Text Sources
Other Literature Sources
Medical
