. 2009 Nov;14(11):992-1003.
doi: 10.1038/mp.2009.82.

The LEARn model: an epigenetic explanation for idiopathic neurobiological diseases

Affiliations

The LEARn model: an epigenetic explanation for idiopathic neurobiological diseases

D K Lahiri et al. Mol Psychiatry. 2009 Nov.

Abstract

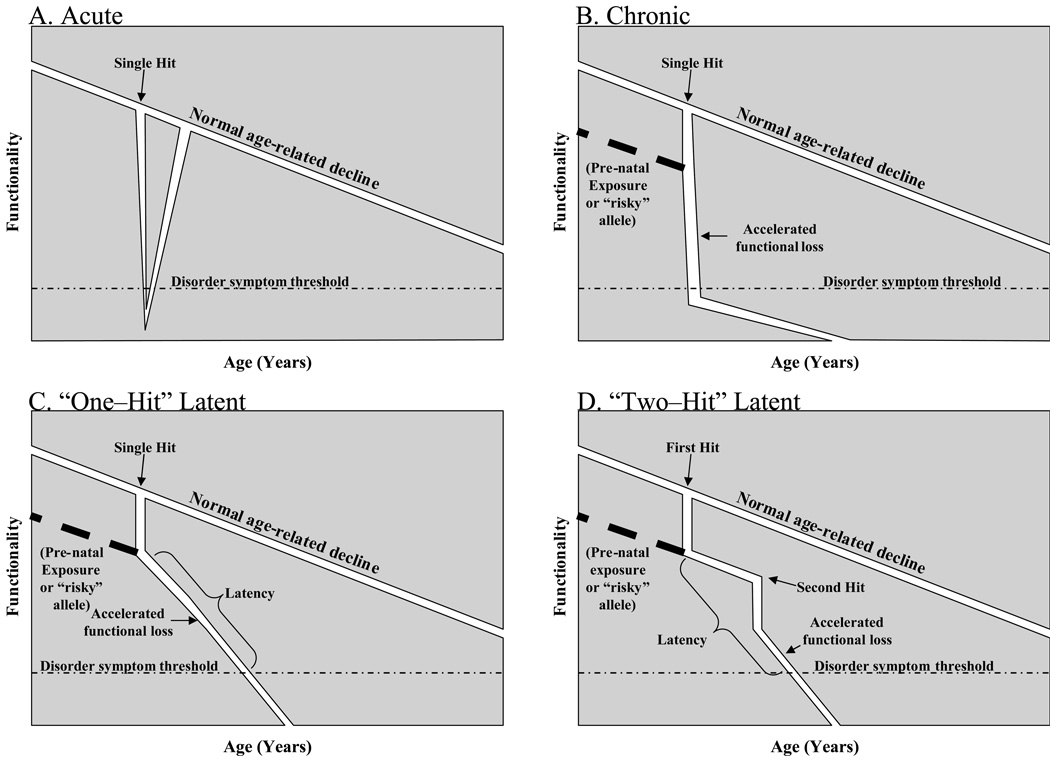
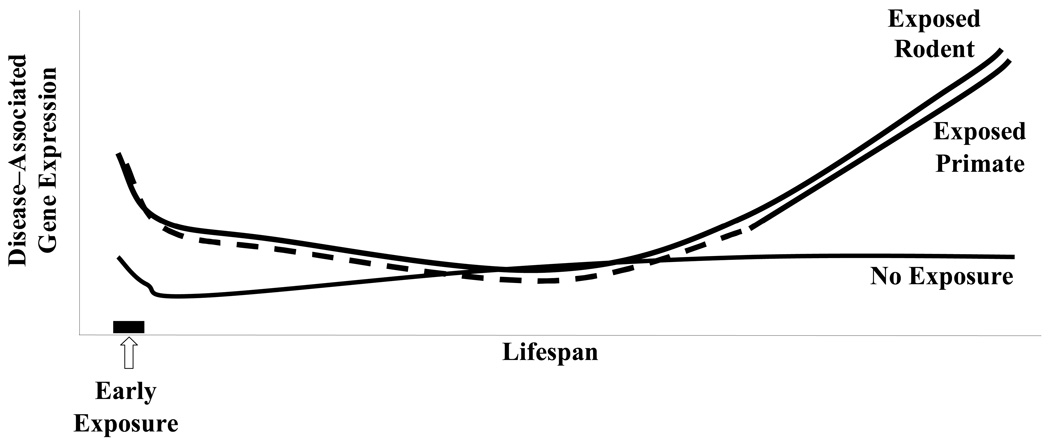
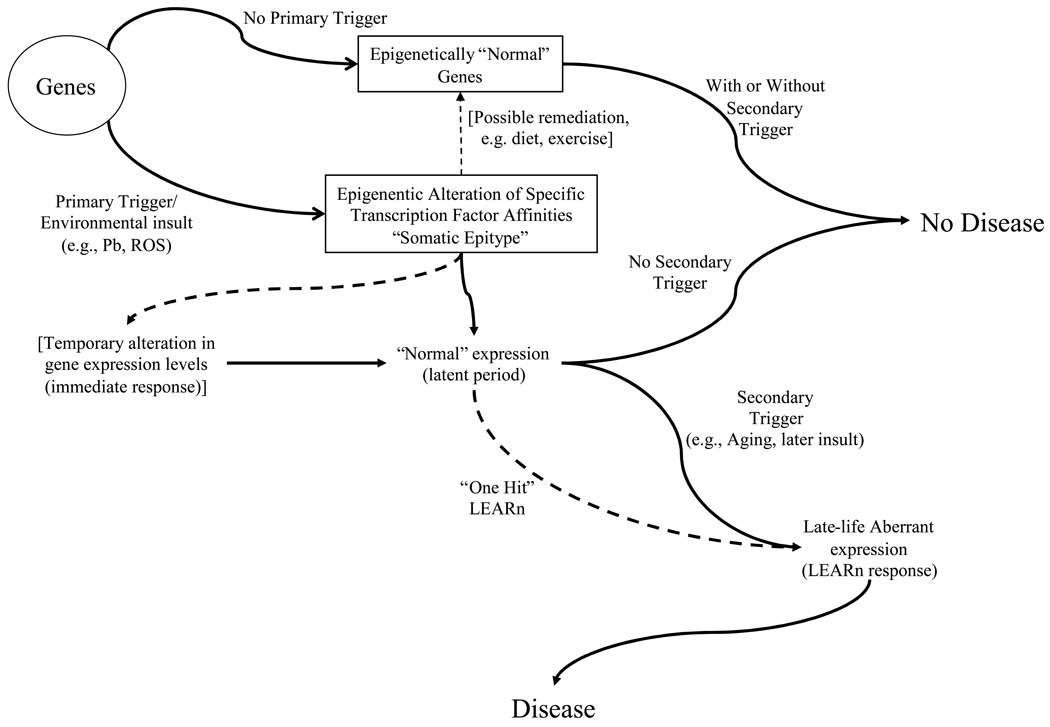
Neurobiological disorders have diverse manifestations and symptomology. Neurodegenerative disorders, such as Alzheimer's disease, manifest late in life and are characterized by, among other symptoms, progressive loss of synaptic markers. Developmental disorders, such as autism spectrum, appear in childhood. Neuropsychiatric and affective disorders, such as schizophrenia and major depressive disorder, respectively, have broad ranges of age of onset and symptoms. However, all share uncertain etiologies, with opaque relationships between genes and environment. We propose a 'Latent Early-life Associated Regulation' (LEARn) model, positing latent changes in expression of specific genes initially primed at the developmental stage of life. In this model, environmental agents epigenetically disturb gene regulation in a long-term manner, beginning at early developmental stages, but these perturbations might not have pathological results until significantly later in life. The LEARn model operates through the regulatory region (promoter) of the gene, specifically through changes in methylation and oxidation status within the promoter of specific genes. The LEARn model combines genetic and environmental risk factors in an epigenetic pathway to explain the etiology of the most common, that is, sporadic, forms of neurobiological disorders.


Figures

Fig. 1
Fig. 1. Models of disease progression
Disease progression usually follows one of four models. A) Acute disease. An etiologic agent or condition “single hit” (including a genetic mutation) takes immediate or near–term to exposure effect, resulting in loss of function that progresses to disease symptoms, which eventually recede. B) Immediate–trigger chronic disease. An etiologic agent or condition takes immediate or near–term to exposure effect, resulting in loss of function that progresses to disease symptoms, which continue throughout life, or at least for some considerable time. C) One–hit latent disease. An etiologic agent or condition imposes immediate or near–term effect, but the effects are subclinical for an extended period. Over time, loss of function increases to a pathological level without any further “hits” to the organism. D) Two–hit latent disease. An etiologic agent or condition affects an organism but does not result in a diseased state. This alteration is maintained through the organism’s lifespan without readily visible effect unless a second hit intrudes. This interacts with the “embedded effect” of the first to produce a disease state.
Fig. 2
Fig. 2. LEARn effected gene expression
Diagrammatic representation of expression levels for disease–associated genes according to the LEARn model based upon rodent and primate research., A) Susceptible genes undergo an early–life exposure to a stress such as heavy metals, inadequate maternal care, or nutritional deficit. This may result in an acute increase in expression levels that quickly returns to “normal” expression. Later in life an additional trigger may affect genes. Those organisms that have been previously subject to the initial trigger experience a significant increase in expression levels of disease–associated genes, while genes in organisms not primed in such a manner do not. B) Schematic representation of pathologically–associated genes and DNA oxidation damage in relationship to LEARn. Shortly after exposure to initial trigger, genes associated with a disorder would experience alterations such as an increase in expression level, while overall DNA oxidation would not be perturbed early in life. Later in life, DNA oxidation would be perturbed, which would lead to activation of the promoters of disease–associated genes, leading to active disease.
Fig. 3
Fig. 3. The LEARn model
Schematic representation of LEARn–type disease progression. A gene or genes associated with a disorder may be subject to an environmental “first trigger”, such as exposure to Pb or ROS. This results in an epigenetically marked gene, through methylation, oxidative damage of DNA, and/or chromatin rearrangement. The epigenetically marked gene may undergo a temporary change in expression levels, but this returns to “normal” levels. If a secondary trigger, such as additional environmental insult or systemic changes in gene expression patterns associated with aging, further affects the gene(s), expression levels deviate from normal, resulting in a disease state. Dotted lines represent alternate pathways.
Fig. 4
Fig. 4. “LEARned” vs. “unLEARned” genes, CpG or GG density
Graphs of A) CpG or B) GG density of genomic DNA sequences from 26 monkey genes, of −3000 to +3000 bases around the +1 TSS in 200bp window. Sequences were chosen after microarray of mRNA or by Northern blotting of mRNA indicated alterations in expression levels 23 years after exposure to Pb (black line).. These were compared to 26 genes with expression levels not altered 23 years after exposure to Pb (gray line). The “non–responding” genes were selected at random from the same RNA array that determined the “responding” genes. Graphs depict standard error of the mean along the sequence of CpG or GG density. Regions where differences in CpG density in the selected window size were significant at p < 0.05 are indicated with brackets under the graphs.
Fig. 5
Fig. 5. Comparison of “unLEARned” MAPT gene with the LEARned gene model
The MAPT gene, which did not respond to early–life Pb, was chosen for comparison with the LEARned gene model. CpG densities in a 200bp running window were calculated. Regions where MAPT resembles “unLEARned” genes are indicated with arrows.

References

    1. Hardy J. A hundred years of Alzheimer's disease research. Neuron. 2006;52(1):3–13. - PubMed
    1. Maslow K. 2008 Alzheimer's disease facts and figures. Alzheimers Dement. 2008;4(2):110–133. - PubMed
    1. Weintraub D, Comella CL, Horn S. Parkinson's disease--Part 3: Neuropsychiatric symptoms. Am J Manag Care. 2008;14(2 Suppl):S59–S69. - PubMed
    1. Steyaert JG, De la Marche W. What's new in autism? Eur J Pediatr. 2008;167(10):1091–1101. - PubMed
    1. Gonzalez JM, Bowden CL, Katz MM, Thompson P, Singh V, Prihoda TJ, et al. Development of the Bipolar Inventory of Symptoms Scale: concurrent validity, discriminant validity and retest reliability. Int J Methods Psychiatr Res. 2008;17(4):198–209. - PMC - PubMed

Publication types