. 2010 Jan 6;29(1):55-67.
doi: 10.1038/emboj.2009.313. Epub 2009 Oct 22.

Self-regulation of Stat3 activity coordinates cell-cycle progression and neural crest specification

Affiliations

Self-regulation of Stat3 activity coordinates cell-cycle progression and neural crest specification

Massimo Nichane et al. EMBO J. .

Abstract

A complex set of extracellular signals is required for neural crest (NC) specification. However, how these signals function to coordinate cell-cycle progression and differentiation remains poorly understood. Here, we report in Xenopus a role for the transcription factor signal transducers and activators of transcription-3 (Stat3) in this process downstream of FGF signalling. Depletion of Stat3 inhibits NC gene expression and cell proliferation, whereas overexpression expands the NC domain and promotes cell proliferation. Stat3 is phosphorylated and activated in ectodermal cells by FGFs through binding with FGFR4. Stat3 activation is also modulated by Hairy2 and Id3 proteins that, respectively, facilitate and disrupt Stat3-FGFR4 complex formation. Furthermore, distinct levels of Stat3 activity control Hairy2 and Id3 transcription, leading to Stat3 self-regulation. Finally, high Stat3 activity maintains cells in an undifferentiated state, whereas low activity promotes cell proliferation and NC differentiation. Together, our data suggest that Stat3, downstream of FGFs and under the positive and negative feedback regulation of Hairy2 and Id3, plays an essential role in the coordination of cell-cycle progression and differentiation during NC specification.


Conflict of interest statement

The authors declare that they have no conflict of interest.

Figures

Figure 1
Figure 1
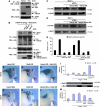
Stat3 regulates NC formation upstream of neural border specifiers. (A) Stat3 MO (10–15 ng per blastomere) but not Stat3 MO7mis (15 ng per blastomere) blocks endogenous Stat3 translation in animal cap explants. Western blot were performed using anti-Stat3 (top) and anti-GAPDH (bottom, loading control) antibodies. (B–N) Whole-mount in situ hybridization of embryos injected with a Stat3 MO (15 ng), a Stat3 MO7mis (15 ng) or Stat3-GR mRNA (200 pg) and analysed with indicated probes. (B–E) Stat3 depletion inhibits NC markers. Snail2 is reduced in Stat3 MO (B, 62%, n=42) but not in Stat3 MO7mis (C, 90% unaffected, n=30)-injected neurula embryos. Snail2 and Sox10 are also reduced at tailbud stages (D, 56%, n=18; E, 58%, n=26). (F–H) Stat3 gain of function increases NC markers. Stat3–GR overexpression expands Snail2 at neurula stage (F, 68%, n=25). At tailbud stage, Snail2 like Sox10 is still expanded (G, 52%, n=21; H, 57%, n=35). Dex was added around stage 11.5–12. (I–N) Stat3 acts upstream of neural border specifiers. Stat3 MO injection reduces Msx1 (I, 60%, n=20), Pax3 (J, 50%, n=14) and SoxD (K, 34%, n=24). Conversely, Stat3–GR overexpression increases Msx1 (L, 45%, n=22), Pax3 (M, 56%, n=16) and SoxD (N, 55%, n=18). Neurula embryos are shown in dorso-anterior views with the injected side to the right. Tailbud embryos are shown in lateral views, with insets showing the control side.
Figure 2
Figure 2
Stat3 is activated by FGF signals through FGFR4. (A, B) Western blot analysis of animal caps derived from embryos injected with Stat3 (500 pg) alone or together with bFGF (FGF2), FGF3, eFGF (FGF4), FGF8a (100 pg each) or with caFGFR1 or caFGFR4 (500 pg and 1 ng) using anti-phosphorylated Tyr705 Stat3 (top) and anti-Stat3 (bottom) antibodies. A control western blot shows the level of overexpressed Myc-tagged caFGFR1 and caFGFR4. FGFs and caFGFR4 strongly induce Stat3 Tyr705 phosphorylation, while caFGFR1 has a modest effect. Note that caFGFR1 is expressed at a higher level than caFGFR4, although the same quantity of mRNA of both constructs was injected. (C) Luciferase assay using animal caps derived from embryos injected with a Stat reporter plasmid alone or together with caFGFR1 (500 pg and 1 ng), caFGFR4 (500 pg and 1 ng) or with caFGFR4 (1 ng) and Stat3YF–GR (500 pg). FGFR4, but not FGFR1, increases reporter activity. Stat3YF–GR abolishes reporter activation by caFGFR4. A control western blot shows the level of overexpressed Myc-tagged caFGFR1 and caFGFR4. (D) Co-IP using extracts from embryos overexpressing Stat3–HA and FGFR1-4 IC–Flag. Stat3 interacts with FGFR4-IC but not with the others FGFRs-IC. H indicates heavy chain. (E–H) Stat3 is required for NC downstream of FGFR4. Whole-mount in situ hybridization or pH3 immunostaining (arrows) of embryos injected with caFGFR4 (500 pg) together with Stat3 MO7mis (15 ng) or Stat3 MO (15 ng). Snail2 and the number of proliferating cells are increased by caFGFR4 in Stat3 MO7mis-injected embryos (E, 65%, n=24; G, 52%, n=29), but is decreased in Stat3-depleted embryos (F, 57%, n=14; H, 56%, n=27). Neurula embryos are shown in dorso-anterior views, with the injected side to the right.
Figure 3
Figure 3
Hairy2 enhances Stat3 activation in NC by facilitating FGFR4–Stat3 complex formation. (A) Endogenous Stat3 binds to overexpressed Hairy2–HA but not to Notch ICD–HA in co-IPs. (B) Co-IP using extracts from embryos injected with Stat3–HA and FGFR4 IC–Flag with or without Hairy2ΔNterm–HA or Hairy2–HA. Hairy2, but not Hairy2ΔNterm, enhances Stat3 binding to FGFR4-IC. H and L indicate heavy and light chains, respectively. (C, D) Western blot analysis of animal caps derived from embryos injected with Stat3 (500 pg), eFGF (100 pg), Hairy2 MOs (15 ng), Hairy2–GR (500 pg) and Hairy2ΔNterm–GR (500 pg), as indicated, using anti-phosphorylated Tyr705 Stat3 (top) and anti-Stat3 (bottom) antibodies. Hairy2 cooperates with FGF to increase pTyr705 Stat3 level, while Hairy2 knockdown or Hairy2ΔNterm has the opposite effect. (E) Luciferase assay using animal caps derived from embryos injected with a Stat reporter plasmid alone or together with Hairy2–GR (500 pg), Hairy2ΔNterm–GR (500 pg), Hairy2 MOs (15 ng) and caFGFR4 (1 ng), as indicated. Hairy2 increases luciferase activity while Hairy2 depletion or Hairy2ΔNterm reduces it, even in presence of caFGFR4. (F–M) Hairy2 and Stat3 cooperate in NC. Whole-mount in situ hybridization of tailbud embryos injected with Hairy2GR (100 pg), Stat3GR (50 pg), Hairy2 MOs (7.5 ng) and Stat3 MO (7.5 ng), alone or in combination as indicated (F–H, J–L). Sox10 is increased by co-injection of Hairy2GR and Stat3GR mRNA (H, 59%, n=27), but not when they are injected alone (F, 83%, unaffected, n=24; G, 80%, n=26). Conversely, Sox10 is decreased in embryos co-injected with sub-effective doses of Hairy2 and Stat3 MOs (L, 67% n=24), but not when they are injected alone (J, 86%, normal, n=21; K, 93% n=30). Tailbud embryos are shown in lateral views, with insets showing control sides. qPCR analysis of Sox10 expression in in vitro NC induced animal caps derived from embryos injected with Hairy2GR (25 pg per blastomere), Stat3GR (25 pg per blastomere), Hairy2 MOs (4 ng per blastomere) and Stat3 MO (4 ng per blastomere), alone or in combination as indicated (I, M). As in embryos, only coexpression of Hairy2 and Stat3 or their simultaneous depletion affects Sox10. A control western blot shows in panel I that similar levels of Myc–Hairy2–GR and Stat3–GR have been produced under each condition.
Figure 4
Figure 4
Id3 negatively regulates Stat3 activation in NC by disrupting Stat3–Hairy2–FGFR4 ternary complex. (A, B) Western blot analysis of animal caps derived from embryos injected with Stat3 (500 pg), eFGF (100 pg), Id3 MO (20 ng) and Id3GR (500 pg), as indicated, using anti-phosphorylated Tyr705 Stat3 (top) and anti-Stat3 (bottom) antibodies. Id3 depletion enhances Stat3 Tyr705 phosphorylation by FGF, while Id3 inhibits it. (C) Luciferase assay using animal caps derived from embryos injected with a Stat3 reporter alone or with Id3GR (500 pg), Id3 MO (20 ng) and caFGFR4 (1 ng), as indicated. Id3, even in presence of caFGFR4, reduces the level of Stat reporter activity, while Id3 depletion enhances it. Note that co-injection of Id3 MO and caFGFR4 mRNA activates the Stat reporter more strongly than caFGFR4 alone. (D) Endogenous Stat3 interacts with overexpressed Id3–HA but not with XNAP/Nrarp–HA in co-IP. (E) Co-IP using extracts from embryos injected with Stat3Flag and Id3HA, alone or together with increasing doses of Hairy2HA. LacZ was used to keep constant the amount of injected mRNA. Stat3–Flag was immunoprecipitated and binding of Id3–HA and Hairy2–HA to Stat3 was analysed. Note that binding of Id3 and Hairy2 to Stat3 is mutually exclusive. (F) Co-IP using extracts from embryos overexpressing Stat3HA and FGFR4-ICFlag, with or without Id3HA or Hairy2HA. Id3, in contrast to Hairy2, decreases the amount of Stat3 co-immunoprecipitated with FGFR4-IC. H and L indicate heavy and light chains, respectively. (G–P) Id3 inhibits Stat3 function in NC. Whole-mount in situ hybridization of embryos injected with Stat3GR (200 pg, G, H, M–O or 500 pg, I, J) alone or together with Id3GR (500 pg, H, J) or with an Id3 MO (20 ng, N) or Hairy2 MOs (15 ng, O) and analysed with Sox10 or Delta1. qPCR analysis of Sox10 and Delta1 in in vitro NC induced animal caps derived from embryos injected with Stat3GR (100 pg per blastomere) alone or together with Id3GR (100 pg per blastomere), an Id3 MO (10 ng per blastomere) or Hairy2 MOs (7.5 ng per blastomere), and harvested at the indicated stages (K, L, P). Controls western blots show the level of Stat3–GR and Flag–Id3–GR produced under each condition in panels K, L, P. Id3 blocks Stat3's ability to expand Sox10 and induce Delta1 in embryos and in in vitro NC induced explants. Respective expansions/inductions: G, 54%, n=35; H, 16%, n=28; I, 67%, n=15; J, 0%, n=19. Id3 knockdown enhances the Stat3 overexpression phenotype. Stat3GR, which alone has no effect (M, 80% unaffected, n=26), strongly upregulates Delta1 (N, 58%, n=19) in the presence of the Id3 MO in embryos and in in vitro NC induced explants. No such effect was observed upon co-injection of Hairy2 MOs (O, 92% unaffected, n=12). Neurula embryos are shown in dorso-anterior views, with the injected side to the right, or in lateral views, with insets showing the control sides.
Figure 5
Figure 5
Stat3 controls Hairy2 and Id3 transcription in an opposite and dose dependent manner. (A–D) Whole-mount in situ hybridization of neurula embryos injected with a Stat3 MO (15 ng) and analysed with the indicated markers. Stat3 depletion reduces Hairy2 (A, 59%, n=17) and Delta1 (D, 46%, n=26), and increases Id3 (B, 65%, n=20) and BMP4 (C, 43%, n=28). Neurula embryos are shown in dorso-anterior views, with the injected side to the right. (EL) Different doses of Stat3–GR have distinct effects on Hairy2, Id3, BMP4 and Delta1 expression. Embryos were injected with increasing amounts of Stat3GR mRNA (100, 200 and 500 pg) and analysed at neurula stage by whole-mount in situ hybridization with the indicated probes. For each marker, the percentage of embryos with normal, reduced or increased expression at different doses of Stat3 used is shown (E–H). qPCR analysis of Hairy2, Id3, BMP4 and Delta1 expression in in vitro NC induced animal caps derived from embryos injected with increasing amount of Stat3GR (50, 100 and 250 pg per blastomere). A control western blot shows that increasing levels of the Stat3–GR protein have been produced (I–L). In embryos and in in vitro NC induced explants, Hairy2 is induced and BMP4 is repressed at a low dose of Stat3. In contrast, Delta1 and Id3 are upregulated at higher doses.
Figure 6
Figure 6
Stat3 has dose-dependent effects on NC and cell-cycle markers. (AF) Different doses of Stat3–GR have distinct effects on NC markers. Embryos were injected with increasing amounts of Stat3GR mRNA (100, 200 and 500 pg) and analysed by whole-mount in situ hybridization for Snail2 and SoxD at neurula stage and Sox10 at tailbud stage. For each marker, the percentage of embryos with normal, reduced or increased expression at different doses of Stat3 used is shown (A–C). qPCR analysis of Snail2, Sox10 and SoxD expression in in vitro NC induced animal caps derived from embryos injected with increasing amounts of Stat3GR (50, 100 and 250 pg per blastomere) (D–F). In embryos and in in vitro NC induced explants, Stat3GR increases Snail2 and Sox10 at low doses and inhibits their expression at higher doses. SoxD is progressively upregulated upon increasing the dose of Stat3–GR. (GK) Dose-dependent effects of Stat3 on cell cycle. Percentage of embryos injected with increasing amounts of Stat3GR (100, 200 and 500 pg) showing increased pH3 (G) or TUNEL (H) staining. Stat3–GR efficiently promotes cell proliferation only at low dose. No change in the number of apoptotic cells is observed at the different doses of Stat3–GR tested. qPCR analysis of CyclinD1, CDK4 and p27XIC1 in in vitro NC induced animal caps derived from embryos injected with increasing amounts of Stat3GR (50, 100 and 250 pg per blastomere) (I–K). CDK4 is efficiently induced only at a low dose of Stat3. In contrast, p27XIC1 is induced at a high dose.
Figure 7
Figure 7
A model of Stat3 self-regulation in NC. Stat3, downstream of FGF signalling, self-regulates its activity through threshold-dependent activation of a positive (Hairy2) and a negative (Id3) feedback loop. The black arrows indicate transcriptional regulation and blue arrows direct protein–protein interactions.

References

    1. Ahrens K, Schlosser G (2005) Tissues and signals involved in the induction of placodal Six1 expression in Xenopus laevis. Dev Biol 288: 40–59 - PubMed
    1. Amaya E, Musci TJ, Kirschner MW (1991) Expression of a dominant negative mutant of the FGF receptor disrupts mesoderm formation in Xenopus embryos. Cell 66: 257–270 - PubMed
    1. Aoki Y, Saint-Germain N, Gyda M, Magner-Fink E, Lee YH, Credidio C, Saint-Jeannet JP (2003) Sox10 regulates the development of neural crest-derived melanocytes in Xenopus. Dev Biol 259: 19–33 - PubMed
    1. Bellmeyer A, Krase J, Lindgren J, LaBonne C (2003) The protooncogene c-myc is an essential regulator of neural crest formation in Xenopus. Dev Cell 4: 827–839 - PubMed
    1. Besser D, Bromberg JF, Darnell JE, Hanafusa H (1999) A single amino acid subsitution in the v-Eyk intracellular domain results in activation of Stat3 and enhances cellular transformation. Moll Cell Biol 19: 1401–1409 - PMC - PubMed

Publication types

MeSH terms

Substances

LinkOut - more resources