. 2009 Oct;5(10):e1000697.
doi: 10.1371/journal.pgen.1000697. Epub 2009 Oct 23.

Loss of yeast peroxiredoxin Tsa1p induces genome instability through activation of the DNA damage checkpoint and elevation of dNTP levels

Affiliations

Loss of yeast peroxiredoxin Tsa1p induces genome instability through activation of the DNA damage checkpoint and elevation of dNTP levels

Hei-Man Vincent Tang et al. PLoS Genet. 2009 Oct.

Abstract

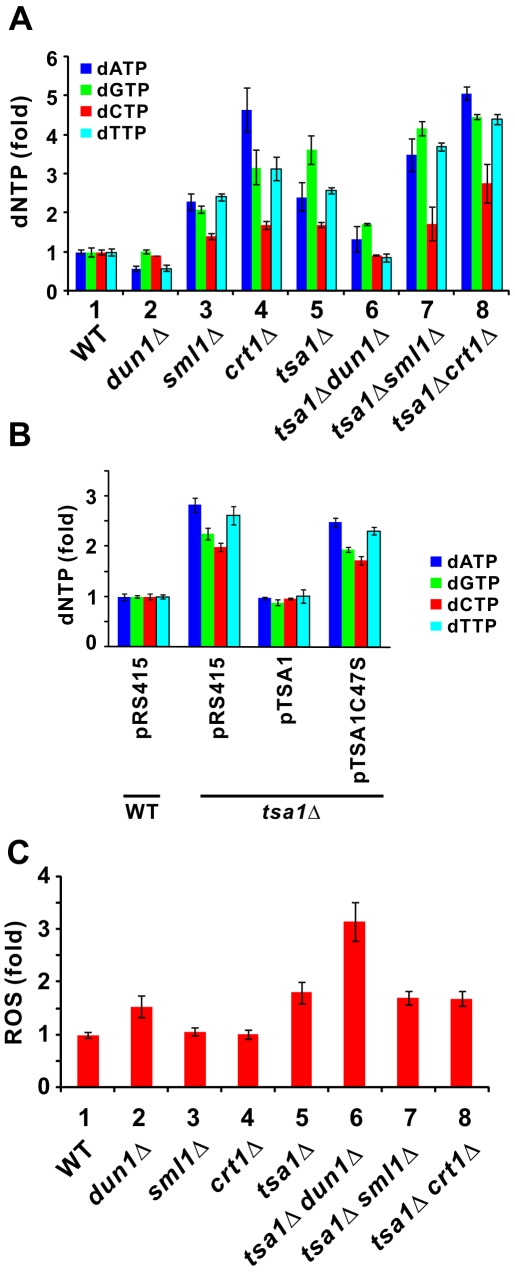
Peroxiredoxins are a family of antioxidant enzymes critically involved in cellular defense and signaling. Particularly, yeast peroxiredoxin Tsa1p is thought to play a role in the maintenance of genome integrity, but the underlying mechanism is not understood. In this study, we took a genetic approach to investigate the cause of genome instability in tsa1Delta cells. Strong genetic interactions of TSA1 with DNA damage checkpoint components DUN1, SML1, and CRT1 were found when mutant cells were analyzed for either sensitivity to DNA damage or rate of spontaneous base substitutions. An elevation in intracellular dNTP production was observed in tsa1Delta cells. This was associated with constitutive activation of the DNA damage checkpoint as indicated by phosphorylation of Rad9/Rad53p, reduced steady-state amount of Sml1p, and induction of RNR and HUG1 genes. In addition, defects in the DNA damage checkpoint did not modulate intracellular level of reactive oxygen species, but suppressed the mutator phenotype of tsa1Delta cells. On the contrary, overexpression of RNR1 exacerbated this phenotype by increasing dNTP levels. Taken together, our findings uncover a new role of TSA1 in preventing the overproduction of dNTPs, which is a root cause of genome instability.


Conflict of interest statement

The authors have declared that no competing interests exist.

Figures

Figure 1
Figure 1. Influence of DUN1, SML1, or CRT1 deletion on the sensitivity of tsa1Δ cells to DNA damage and replicative stress.
(A) Spot tests. Ten-fold serial dilutions of strains BY4741 (WT), dun1Δ, sml1Δ, crt1Δ, tsa1Δ, tsa1Δ dun1Δ, tsa1Δ sml1Δ, and tsa1Δ crt1Δ were spotted on YPD medium containing indicated doses of H2O2, HU or 4-NQO. Cells were exposed to the indicated dose of UV after plating. Plates were incubated for 4 days at 30°C. Experiments were repeated for six times and similar results were obtained. (B) Survival curves. Logarithmically growing yeast cells, BY4741 (WT), dun1Δ, sml1Δ, tsa1Δ, tsa1Δ dun1Δ, and tsa1Δ sml1Δ, in YPD were treated with indicated doses of 4-NQO for 90 min before plating on YPD agar. For UV treatment, cells were first plated onto YPD agar followed by UV irradiation at the indicated doses. Plates were incubated for 3 days at 30°C, and then counted for survival. The number of colonies from untreated plates was taken as 100%. Experiments were repeated for three times and similar results were obtained. (C) TSA1 catalytic cysteine mutant cannot complement the HU sensitivity in tsa1Δ cells. Tenfold serial dilutions of the indicated strains transformed with pRS415, pTSA1, pTSA1C47S, or pTSA1C170S were spotted on SC-Leu plates containing 2% glucose and the indicated doses of diamide or HU. Note that cells grew more slowly on SC plates than on YPD plates as shown in (A). (D) Influence of DUN1, SML1, or CRT1 deletion on the sensitivity of sod1Δ cells to DNA damage. (E) Complementation of drug sensitivity in tsa1Δ dun1Δ cells by TSA1 or DUN1.
Figure 2
Figure 2. Influence of DUN1, SML1, or CRT1 deletion on the mutation rates of tsa1Δ cells.
The number of CANR (A) or 5FCR (B) colonies on synthetic complete solid medium either lacking arginine but containing CAN (60 mg/L) or supplemented with 5FC (100 mg/L) was normalized with the total number of viable cells grown on the same solid medium without CAN or 5FC. The relative mutation rate of BY4741 cells (WT) was taken as 1.00. Results represent the average from triplicate analysis of ten independent cultures. (C) Complementation of mutator phenotype in tsa1Δ dun1Δ cells by TSA1 or DUN1. The rates of spontaneous CANR mutation were calculated as in (A). (D) Influence of ROS on mutation rates. Cells of the indicated genotypes logarithmically growing in YPD were subjected to treatment of H2O2 (0.6 mM, 15 min) before plating on synthetic complete solid medium lacking arginine and supplemented with CAN (60 mg/L). The rates of spontaneous CANR mutation were calculated as in (A).
Figure 3
Figure 3. dNTP levels of tsa1Δ cells and influence of DUN1, SML1, and CRT1 deletion.
(A) Comparison of dNTP levels. Relative dNTP levels were determined in the indicated strains of cells growing logarithmically. (B) Suppression of dNTP pool phenotype by TSA1. Assays were done with WT and tsa1Δ strains transformed with pRS415, pTSA1, or pTSA1C47S. (C) ROS detection. Cells of the indicated strains logarithmically growing in YPD were subjected to treatment with DCF (10 µM, 45 min). Crude extracts of cells were subjected to DCF fluorescence measurement on an F-4500 spectrofluorimeter (Hitachi). The excitation and emission wavelengths were 488 and 520 nm, respectively. The reading of DCF fluorescence was normalized to protein concentration. The fluorescent intensity of BY4741 cells (WT) was taken as 1. Results represent the average from three independent experiments.
Figure 4
Figure 4. Overexpression of RNR1 enhances mutator phenotype of tsa1Δ cells.
BY4741 (WT), sod1Δ, and tsa1Δ cells carrying plasmid pGal-RNR1 were grown in SC-Ura medium supplemented with raffinose (uninduced) or galactose (induced) to mid-log phase. (A) Galactose-induced expression of Rnr1-3MYCp. Western blotting was performed with mouse anti-MYC (Roche) and mouse anti-Pgk1p (Invitrogen) antibodies. (B) Mutation rates. Experiments were carried out as in Figure 2.
Figure 5
Figure 5. Activation of DNA damage checkpoint in tsa1Δ cells.
(A) Western blot analysis of Rad53p. Cells of WT, sod1Δ, and tsa1Δ strains logarithmically growing in YPD were subjected to treatment with H2O2 (0.8 mM, 30 min). Western blotting was performed with goat anti-Rad53p (Santa-Cruz) and mouse anti-Pgk1p antibodies. Percentages of phosphorylated Rad53p were determined by densitometry and indicated at the bottom of the panel. (B) TSA1 complementation assay. WT and tsa1Δ cells were transformed with pRS415, pTSA1, or pTSA1C47S plasmid. Western blotting was carried out with goat anti-Rad53p, mouse anti-HA (Santa-Cruz), rabbit anti-histone H2A phosphorylated at S129 (γH2A; Abcam), and mouse anti-Pgk1p antibodies. Relative amounts of Sml1-3HAp or γH2A normalized to Pgk1p were determined by densitometry and indicated at the bottom of the panels. (C) Checkpoint activation in different strains.
Figure 6
Figure 6. Activation of DNA damage checkpoint in tsa1Δ cells.
(A) Western blot analysis of Rad53p. Cells of the indicated strains in W303 background logarithmically growing in YPD were subjected to treatment with H2O2 (0.8 mM, 30 min). (B) Western blot analysis of Rad9p in tsa1Δ and TSA1-complemented strains. A longer exposure (long exp.) of the Rad9p blot was also shown. (C) Semi-quantitative RT–PCR analysis of RNR transcripts. Logarithmically growing cells of the indicated strains in YPD were subjected to treatment with HU (200 mM) at the indicated time points. Total RNA was extracted and 3 µg of RNA was used for cDNA synthesis. PCR was performed to assess the levels of RNR1/2/3/4, HUG1, and ACT1 transcripts. The expected sizes of the PCR product for RNR1, RNR2, RNR3, RNR4, ACT1, and HUG1 are 219, 390, 199, 455, 520, and 190 bp, respectively. Relative levels of RNA determined by densitometry and normalized to the amount of ACT1 transcript were indicated at the bottom of the panels.
Figure 7
Figure 7. Impact of RAD53 mutation on tsa1Δ cells.
(A) Western blot analysis of Rad53p and Sml1-3HAp. Cells of the indicated strains in W303 background logarithmically growing in YPD were subjected to treatment with H2O2 (0.8 mM, 30 min). Western blotting was performed as in Figure 5B. (B) Spot assay. Ten-fold serial dilutions of the indicated strains were spotted on YPD medium containing the indicated doses of H2O2 or HU. Some cells were exposed to UV after plating. (C) RAD53 mutation suppresses mutator phenotype in tsa1Δ cells. Mutation rates were calculated as in Figure 2B. (D) ROS detection. DCF fluorescence was measured as in Figure 3C.

Similar articles

Cited by

References

    1. Rhee SG, Chae HZ, Kim K. Peroxiredoxins: a historical overview and speculative preview of novel mechanisms and emerging concepts in cell signaling. Free Radic Biol Med. 2005;38:1543–1552. - PubMed
    1. Fourquet S, Huang ME, D'Autreaux B, Toledano MB. The dual functions of thiol-based peroxidases in H2O2 scavenging and signaling. Antioxid Redox Signal. 2008;10:1565–1576. - PubMed
    1. Bryk R, Griffin P, Nathan C. Peroxynitrite reductase activity of bacterial peroxiredoxins. Nature. 2000;407:211–215. - PubMed
    1. Wong CM, Zhou Y, Ng RWM, Kung HF, Jin DY. Cooperation of yeast peroxiredoxins Tsa1p and Tsa2p in the cellular defense against oxidative and nitrosative stress. J Biol Chem. 2002;277:5385–5394. - PubMed
    1. Jin DY, Chae HZ, Rhee SG, Jeang KT. Regulatory role for a novel human thioredoxin peroxidase in NF-κB activation. J Biol Chem. 1997;272:30952–30961. - PubMed

Publication types

MeSH terms