

Inferring the joint demographic history of multiple populations from multidimensional SNP frequency data
- PMID: 19851460
- PMCID: PMC2760211
- DOI: 10.1371/journal.pgen.1000695
Inferring the joint demographic history of multiple populations from multidimensional SNP frequency data
Abstract
Demographic models built from genetic data play important roles in illuminating prehistorical events and serving as null models in genome scans for selection. We introduce an inference method based on the joint frequency spectrum of genetic variants within and between populations. For candidate models we numerically compute the expected spectrum using a diffusion approximation to the one-locus, two-allele Wright-Fisher process, involving up to three simultaneous populations. Our approach is a composite likelihood scheme, since linkage between neutral loci alters the variance but not the expectation of the frequency spectrum. We thus use bootstraps incorporating linkage to estimate uncertainties for parameters and significance values for hypothesis tests. Our method can also incorporate selection on single sites, predicting the joint distribution of selected alleles among populations experiencing a bevy of evolutionary forces, including expansions, contractions, migrations, and admixture. We model human expansion out of Africa and the settlement of the New World, using 5 Mb of noncoding DNA resequenced in 68 individuals from 4 populations (YRI, CHB, CEU, and MXL) by the Environmental Genome Project. We infer divergence between West African and Eurasian populations 140 thousand years ago (95% confidence interval: 40-270 kya). This is earlier than other genetic studies, in part because we incorporate migration. We estimate the European (CEU) and East Asian (CHB) divergence time to be 23 kya (95% c.i.: 17-43 kya), long after archeological evidence places modern humans in Europe. Finally, we estimate divergence between East Asians (CHB) and Mexican-Americans (MXL) of 22 kya (95% c.i.: 16.3-26.9 kya), and our analysis yields no evidence for subsequent migration. Furthermore, combining our demographic model with a previously estimated distribution of selective effects among newly arising amino acid mutations accurately predicts the frequency spectrum of nonsynonymous variants across three continental populations (YRI, CHB, CEU).
Conflict of interest statement
The authors have declared that no competing interests exist.
Figures
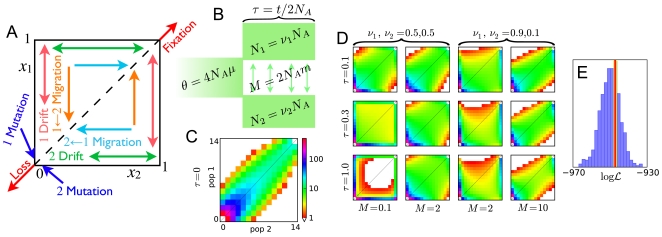
 , the density of alleles at relative frequencies
  and
and  in populations 1 and 2. (B) For the spectra shown, an equilibrium population of effective size
  diverges into two populations
  generations ago. Populations 1 and 2 have effective sizes
  and
and  , respectively. Migration is symmetric at
  per generation, and
  . (C) The AFS at
  . Each entry is colored by the logarithm of the number of sites in it, according to the scale shown. (D) The AFS at various times for various demographic parameters, on the same scale as (B). (E) Comparison between coalescent- and diffusion-based estimates of the likelihood
  of data generated under the model (A). Coalescent-based estimates of the likelihood, each of which took approximately 7.0 seconds, are represented in the histogram. The result from our diffusion approach, which took 2.0 seconds, is represented by the red line. For accuracy comparison, the yellow line indicates the likelihood inferred from
  coalescent simulations.
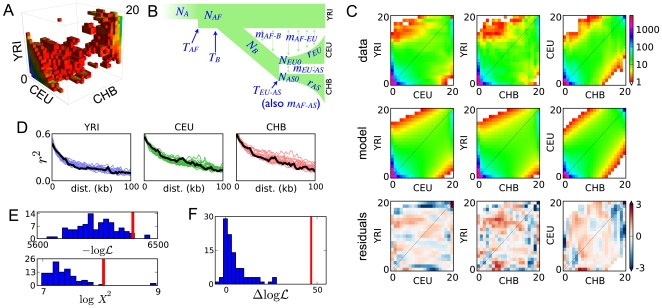
 and Pearson's
  statistic both indicate that our model is a reasonable, though incomplete description of the data. In both plots, the red line results from fitting the real data and the histogram from fits to simulated data. Poorer fits lie to the right (lower
  and higher
  ). (F) The improvement in likelihood from including contemporary migration in the real data fit (red line) is much greater than expected from fits to simulated data generated without contemporary migration (histogram). This indicates that the data contain a strong signal of contemporary migration.
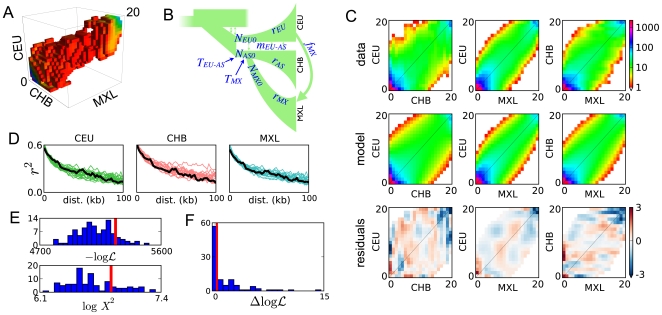
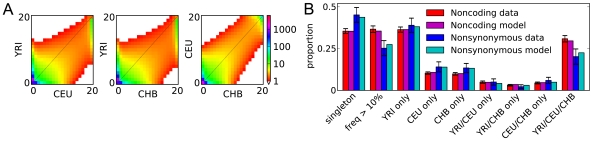
 was set identically, as is the color scale. As expected, selection dramatically reduces the amount of segregating polymorphism. (B) Shown are the proportions of variation found in various frequency classes. As expected, nonsynonymous variants typically have lower frequency. They also less likely to be shared between populations. Data error bars indicate 95% bootstrap confidence intervals.
References
Publication types
MeSH terms
Grants and funding
LinkOut - more resources
Full Text Sources
Other Literature Sources
Miscellaneous
