. 2009 Oct 24:10:493.
doi: 10.1186/1471-2164-10-493.

Quality control in microarray assessment of gene expression in human airway epithelium

Affiliations

Quality control in microarray assessment of gene expression in human airway epithelium

Tina Raman et al. BMC Genomics. .

Abstract

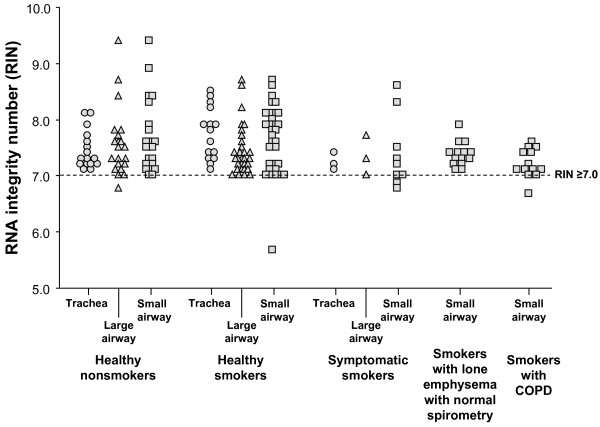
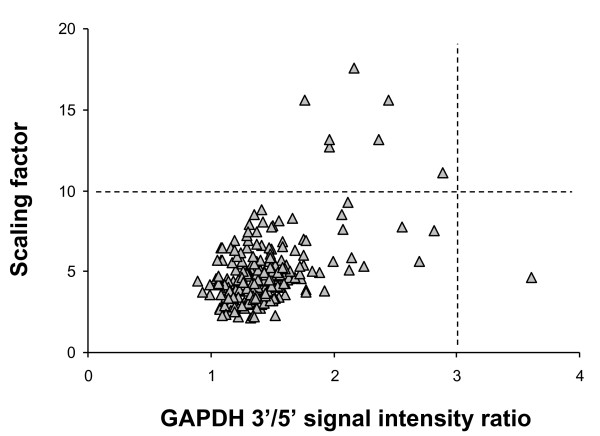
Background: Microarray technology provides a powerful tool for defining gene expression profiles of airway epithelium that lend insight into the pathogenesis of human airway disorders. The focus of this study was to establish rigorous quality control parameters to ensure that microarray assessment of the airway epithelium is not confounded by experimental artifact. Samples (total n = 223) of trachea, large and small airway epithelium were collected by fiberoptic bronchoscopy of 144 individuals and hybridized to Affymetrix microarrays. The pre- and post-chip quality control (QC) criteria established, included: (1) RNA quality, assessed by RNA Integrity Number (RIN) > or = 7.0; (2) cRNA transcript integrity, assessed by signal intensity ratio of GAPDH 3' to 5' probe sets < or = 3.0; and (3) the multi-chip normalization scaling factor < or = 10.0.

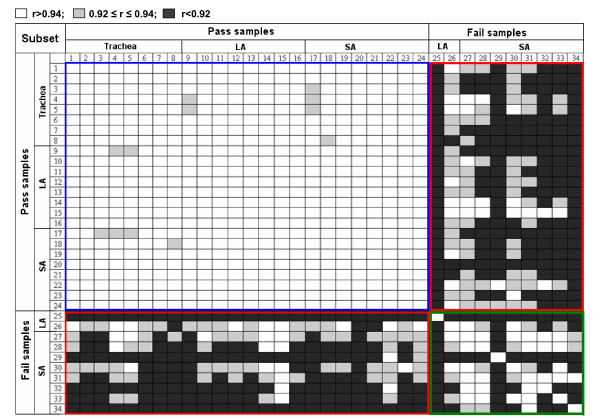
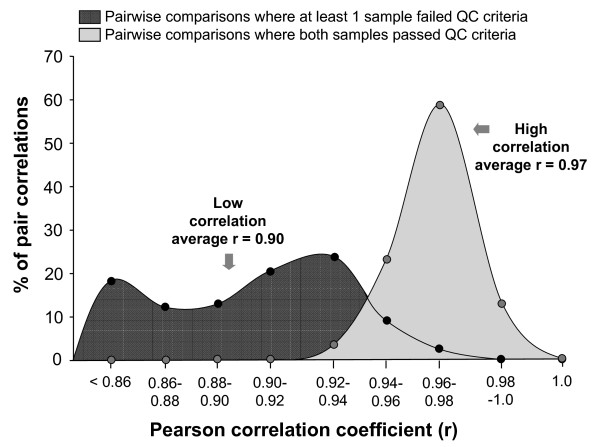
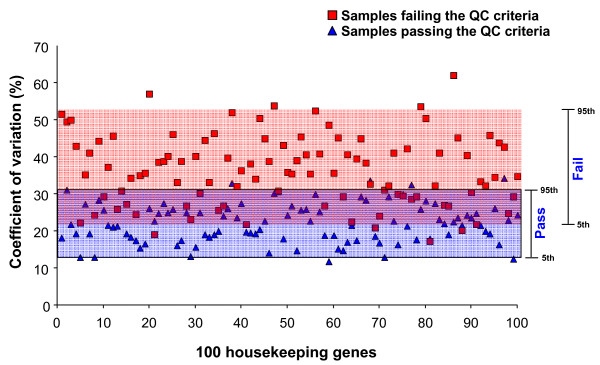
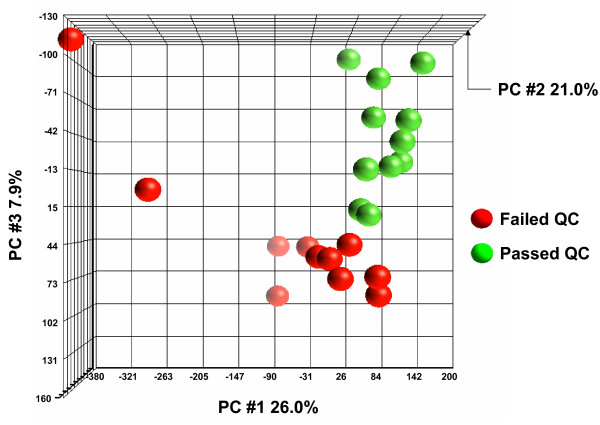
Results: Of the 223 samples, all three criteria were assessed in 191; of these 184 (96.3%) passed all three criteria. For the remaining 32 samples, the RIN was not available, and only the other two criteria were used; of these 29 (90.6%) passed these two criteria. Correlation coefficients for pairwise comparisons of expression levels for 100 maintenance genes in which at least one array failed the QC criteria (average Pearson r = 0.90 +/- 0.04) were significantly lower (p < 0.0001) than correlation coefficients for pairwise comparisons between arrays that passed the QC criteria (average Pearson r = 0.97 +/- 0.01). Inter-array variability was significantly decreased (p < 0.0001) among samples passing the QC criteria compared with samples failing the QC criteria.

Conclusion: Based on the aberrant maintenance gene data generated from samples failing the established QC criteria, we propose that the QC criteria outlined in this study can accurately distinguish high quality from low quality data, and can be used to delete poor quality microarray samples before proceeding to higher-order biological analyses and interpretation.


Figures

Figure 1
Figure 1
Assessment of RNA quality in airway epithelial samples. Integrity of 180 RNA samples was scored using the RNA Integrity Number (RIN) generated by Agilent 2100 Bioanalyzer Software (1 = highly degraded; 10 = intact). Samples are grouped by phenotype as defined in Methods, and within each phenotype the site of the epithelial sample is indicated (trachea; large airway; small airway). Samples with RIN ≥ 7.0, shown by the dotted line, passed QC criterion, while the 5 samples below the dotted line failed the QC criterion.
Figure 2
Figure 2
Assessment of GAPDH 3'/5' and Chip scaling factor. Ratios of signal intensities for GAPDH 3' and 5' probe sets for 223 samples were extracted from the GeneChip Operating Software (GCOS) Quality Report and plotted against the Scaling Factors analyzed with a target intensity value of 500 extracted from the GCOS Quality Report. Samples with GAPDH 3'/5' ratio ≤ 3.0, to the left of the vertical dotted line, passed QC criterion, while the one sample to the right of the dotted line failed the QC criterion. Samples with scaling factor values ≤ 10.0 passed QC criterion (below the horizontal dashed line) while the 7 samples above the dashed line failed the QC criterion.
Figure 3
Figure 3
Pairwise correlations of expression levels for 100 maintenance genes. Expression levels for 100 maintenance genes were determined for 34 airway epithelial samples of which 24 randomly selected samples passed the pre-determined QC criteria and 10 failed one or more of the criteria. The vertical and horizontal numbers refer to the 34 samples, categorized as "pass" or "fail"; LA = large airway; SA = small airway. Pearson correlation coefficients for all pairwise comparisons between the 34 samples were determined and are plotted in grey-scale, with each cell representing a single correlation between two samples (white, r > 0.94; gray, 0.92 ≤ r ≤ 0.94; black, r < 0.92). Shown are the 24 × 24 comparison of samples both passing QC, the 24 × 10 between samples passing QC and samples failing QC, and the 10 × 10 comparison of samples both failing QC. Note that all of the correlation values <0.92 are derived only from pairwise comparisons including samples failing the QC criteria.
Figure 4
Figure 4
Frequency distribution of correlation coefficients calculated for pairwise comparisons. Shaded dark grey region represents pairwise comparisons (n = 285) where at least 1 sample failed the QC criteria. Light grey region represent pairwise comparisons (n = 276) where both samples pass QC criteria. The majority of samples passing the QC criteria have correlation values >0.94.
Figure 5
Figure 5
Variability in maintenance gene expression levels in samples that pass or fail QC criteria. The coefficients of variation for each of the 100 maintenance genes were calculated across 2 data sets: a data set of 10 samples failing QC criteria (red squares), and a randomly selected data set of 10 samples that pass QC criteria (blue triangles). Upper and lower boundaries of shaded regions represent 95th and 5th percentiles, respectively, of coefficient of variation across samples failing the QC criteria (red box) and coefficient of variation across samples passing the QC criteria (blue box).
Figure 6
Figure 6
Principal components analysis of genome-wide gene transcriptome data in failed and passed COPD subjects. The axes have been rotated presenting a top view to highlight the 2 standard deviation ovoid clustering of expression from failed and passed COPD subjects. Each axis represents one principal component (PC), with PC1 on the x axis, PC3 on the y axis and PC2 on the z axis. Failed COPD subjects are represented by red spheres and passed COPD subjects by green spheres.

References

    1. Lockhart DJ, Barlow C. Expressing what's on your mind: DNA arrays and the brain. Nat Rev Neurosci. 2001;2:63–68. doi: 10.1038/35049070. - DOI - PubMed
    1. Schulze A, Downward J. Navigating gene expression using microarrays--a technology review. Nat Cell Biol. 2001;3:E190–E195. doi: 10.1038/35087138. - DOI - PubMed
    1. Stears RL, Martinsky T, Schena M. Trends in microarray analysis. Nat Med. 2003;9:140–145. doi: 10.1038/nm0103-140. - DOI - PubMed
    1. Harvey BG, Heguy A, Leopold PL, Carolan BJ, Ferris B, Crystal RG. Modification of gene expression of the small airway epithelium in response to cigarette smoking. J Mol Med. 2007;85:39–53. doi: 10.1007/s00109-006-0103-z. - DOI - PubMed
    1. Meyer KC. Bronchoalveolar lavage as a diagnostic tool. Semin Respir Crit Care Med. 2007;28:546–560. doi: 10.1055/s-2007-991527. - DOI - PubMed

Publication types

Substances