. 2010 Jan;46(1):236-43.
doi: 10.1016/j.bone.2009.10.012. Epub 2009 Oct 21.

HO-1 expression increases mesenchymal stem cell-derived osteoblasts but decreases adipocyte lineage

Affiliations

HO-1 expression increases mesenchymal stem cell-derived osteoblasts but decreases adipocyte lineage

Luca Vanella et al. Bone. 2010 Jan.

Abstract

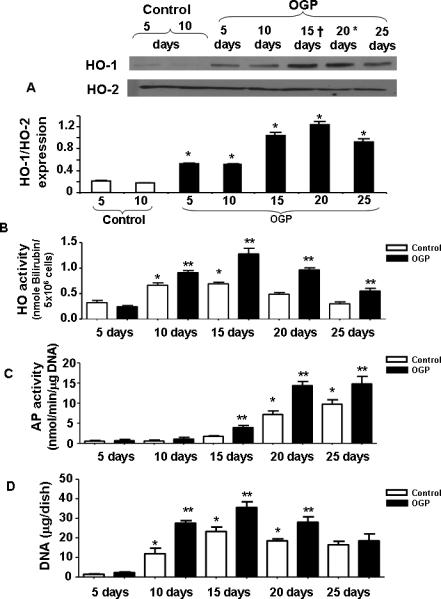
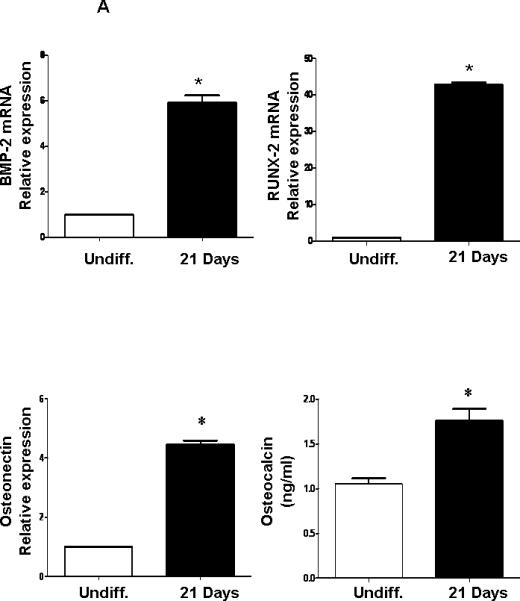
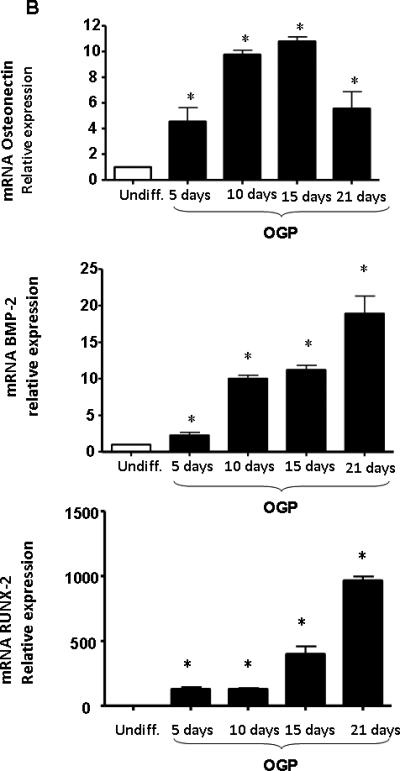
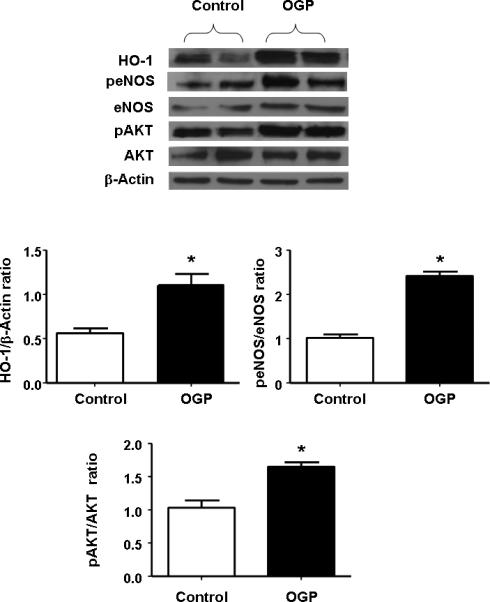
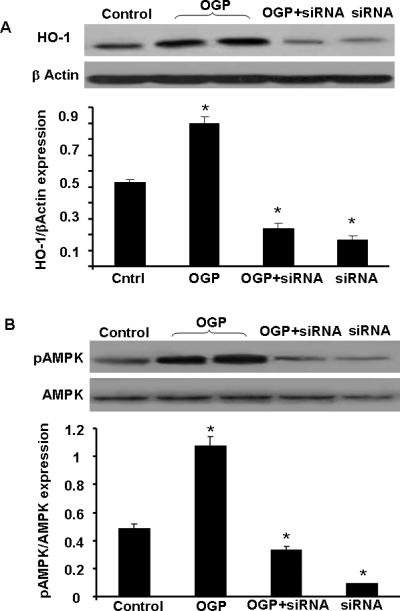
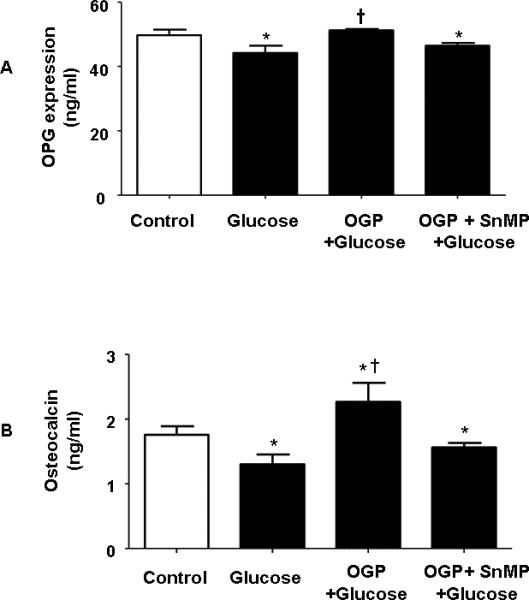
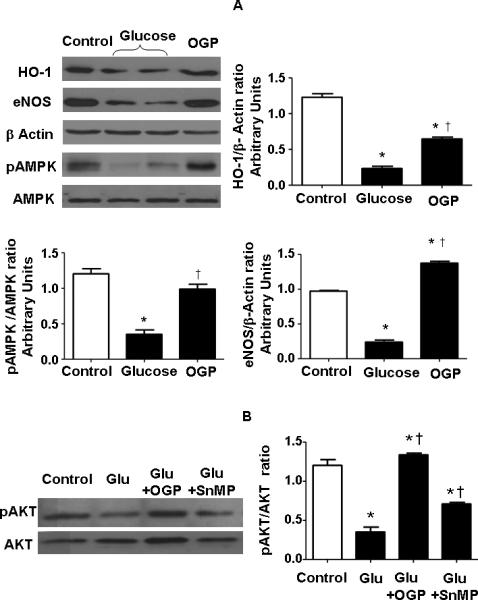
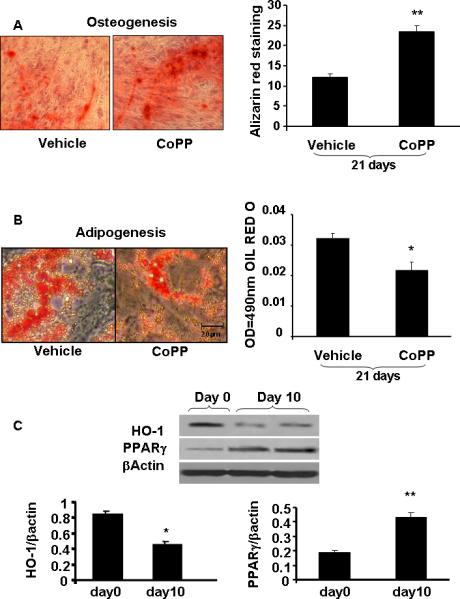
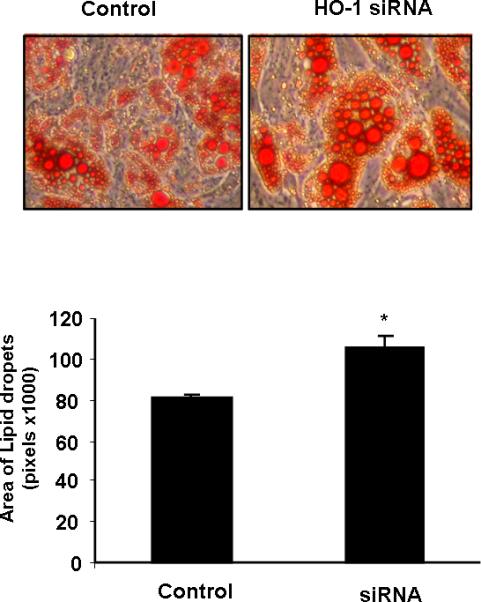
Human bone marrow mesenchymal stem cells (MSC) are pleiotropic cells that differentiate to either adipocytes or osteoblasts as a result of cross-talk by specific signaling pathways including heme oxygenase (HO)-1/-2 expression. We examined the effect of inducers of HO-1 expression and inhibitors of HO activity on MSC differentiation to the osteoblast and adipocyte lineage. HO-1 expression is increased during osteoblast stem cell development but remains elevated at 25 days. The increase in HO-1 levels precedes an increase in alkaline phosphatase (AP) activity and an increase in BMP, osteonectin and RUNX-2 mRNA. Induction of HO-1 by osteogenic growth peptide (OGP) was associated with an increase in BMP-2 and osteonectin. Exposure of MSC to high glucose levels decreased osteocalcin and osteogenic protein expression, which was reversed by upregulation of the OGP-mediated increase in HO-1 expression. The glucose-mediated decrease in HO-1 resulted in decreased levels of pAMPK, pAKT and the eNOS signaling pathway and was reversed by OGP. In contrast, MSC-derived adipocytes were increased by glucose. HO-1 siRNA decreased HO-1 expression but increased adipocyte stem cell differentiation and the adipogenesis marker, PPARgamma. Thus, upregulation of HO-1 expression shifts the balance of MSC differentiation in favor of the osteoblast lineage. In contrast, a decrease in HO-1 or exposure to glucose drives the MSC towards adipogenesis. Thus, targeting HO-1 expression is a portal to increased osteoblast stem cell differentiation and to the attenuation of osteoporosis by the promotion of bone formation.


Figures

Figure 1
Figure 1
A) Effect of OGP (Upper panel) and protein levels in osteoblasts as a function of time during the periods of proliferation and differentiation. Western blot analyses of HO proteins in osteoblast homogenates were performed using antibodies against human HO-1 and HO-2 proteins. Blots shown are representative of 3 separate experiments. B) Effect of OGP on HO activity in isolated cell homogenates of cells harvested after 5, 10, 15, 20 and 25 days of growth. HO activity in osteoblasts was measured as described in Methods. Results are the mean ± SE; n=3; *p<0.05 compared to 5 days OGP treated, effect of OGP on AP activity C) and, DNA accumulation D) AP activity and DNA content were measured as described in the Methods. Data presented are the result of 3 separate experiments. *p<0.001.
Figure 2
Figure 2
A: Expression of osteoblastic markers in differentiated MSCs by PCR. qRTPCR revealed a marked increase in BMP-2, RUNX2, osteocalcin and osteonectin at 21 days of osteoblastic differentiation. Bars represent the mean ± SEM of three independent experiments. *p < 0.05 vs. undifferentiated cells. B) Expression of mRNA of osteonectin, BMP-2 and RUNX-2 with time of exposure to OPG (10-6M). The results are of 3 independent experiments. *p<0.05 vs undifferentiated cells.
Figure 2
Figure 2
A: Expression of osteoblastic markers in differentiated MSCs by PCR. qRTPCR revealed a marked increase in BMP-2, RUNX2, osteocalcin and osteonectin at 21 days of osteoblastic differentiation. Bars represent the mean ± SEM of three independent experiments. *p < 0.05 vs. undifferentiated cells. B) Expression of mRNA of osteonectin, BMP-2 and RUNX-2 with time of exposure to OPG (10-6M). The results are of 3 independent experiments. *p<0.05 vs undifferentiated cells.
Figure 3
Figure 3
Western blot and densitometry analysis of effect of OGP on HO-1 expression, peNOS, and eNOS, pAKT, and AKT proteins measured after 21 days of osteoblast differentiation. We performed quantitative densitometry evaluation of p-eNOS, eNOS, pAKT, AKT in the cells. *p < 0.05 Control vs. OGP. Each bar represents mean SE± of 3 experiments.
Figure 4
Figure 4
A) Western blot analysis of HO in osteoblasts homogenates treated with OGP (10 -6M) for 10 days. In the presence and absence of siRNA HO-1. Immunoblots were performed using antibodies against human HO-1 protein. Blots shown are representative of 3 separate experiments, *<0.05 B) Effect of siRNA HO-1 on OGP-mediated pAMPK activation. *p<0.05 and **p<0.01, compared to OGP, n=4.
Figure 5
Figure 5
A and B) Effect of Glucose (30 mM), OGP + Glucose and SnMP + Glucose OGP + on osteoblast marker expression. ELISA shows an increase of OPG A) and osteocalcin B) those samples treated vehicle solution, control, glucose, glucose + OGP, glucose + OGP + SnMP. Control bars represent the mean ± SEM of three independent experiments. *p < 0.05 vs. undifferentiated cells +p<0.05 compared to glucose. Addition of SnMP caused a statistically significant reduction in the expression of both. p<.05.
Figure 6
Figure 6
A) Lysates of osteoblasts cultured in the presence of a high glucose concentration (30 mM) and OGP were assayed. Representative Western blots are shown for HO-1, eNOS, pAMPK, AMPK, and actin proteins. Bars represent the mean ± SEM of four independent experiments B) pAKT and AKT levels were measured in presence of vehicle solution, glucose (30 mM), glucose + OGP in combination with SnMP. Both CoPP and OGP increased pAKT levels. *p < 0.05 vs. differentiated cells (Control); †p < 0.05 vs. glucose.
Figure 7
Figure 7
Samples were stained as described in Methods to determine A) bone mineralization. CoPP (2.0 μM) was added once every 5 days during culture media change for 21 days. These pictures are representative of 3 repeated experiments at 16 days, **p<0.01 and *p<0.05 compared to control. B) Adipogenesis MSC were treated with 2.0 μM CoPP for 14 days and lipid droplets were stained with Oil red O then measured adipogenesis on 490nm wave length. Levels of significance: *p<0.05 Control vs CoPP; and C) Effect of HO-1 expression on PPARγ expression, *p<0.05, **p<0.02, n=4.
Figure 8
Figure 8
The effect of HO-1 siRNA on adipogenesis. Lipid droplets area was determined by Oil red O staining after 21 days. *p<0.05 control vs HO-1 siRNA

References

    1. Muruganandan S, Roman AA, Sinal CJ. Adipocyte differentiation of bone marrow-derived mesenchymal stem cells: cross talk with the osteoblastogenic program. Cell Mol Life Sci. 2009;66:236–53. - PMC - PubMed
    1. Hamilton EJ, Rakic V, Davis WA, Chubb SA, Kamber N, Prince RL, Davis TM. Prevalence and predictors of osteopenia and osteoporosis in adults with Type 1 diabetes. Diabet Med. 2009;26:45–52. - PubMed
    1. Fowlkes JL, Bunn RC, Liu L, Wahl EC, Coleman HN, Cockrell GE, Perrien DS, Lumpkin CK, Jr., Thrailkill KM. Runt-related transcription factor 2 (RUNX2) and RUNX2-related osteogenic genes are down-regulated throughout osteogenesis in type 1 diabetes mellitus. Endocrinology. 2008;149:1697–704. - PMC - PubMed
    1. Abraham NG, Kappas A. Pharmacological and clinical aspects of heme oxygenase. Pharmacol Rev. 2008;60:79–127. - PubMed
    1. Peterson SJ, Drummond G, Hyun KD, Li M, Kruger AL, Ikehara S, Abraham NG. L-4F treatment reduces adiposity, increases adiponectin levels and improves insulin sensitivity in obese mice. J Lipid Res. 2008;49:1658–69. - PMC - PubMed

Publication types

MeSH terms