

Association of hemodialysis treatment time and dose with mortality and the role of race and sex
- PMID: 19853336
- PMCID: PMC2803335
- DOI: 10.1053/j.ajkd.2009.08.007
Association of hemodialysis treatment time and dose with mortality and the role of race and sex
Abstract
Background: The association of survival with characteristics of thrice-weekly hemodialysis (HD) treatment, including dose or duration of treatment, has not been completely elucidated, especially in different race and sex categories.
Study design: We examined associations of time-averaged and quarterly varying (time-dependent) delivered HD dose and treatment time and 5-year (July 2001-June 2006) survival.
Setting & participants: 88,153 thrice-weekly-treated HD patients from DaVita dialysis clinics.
Predictors: HD treatment dose (single-pool Kt/V) and treatment time.
Outcomes & other measurements: 5-Year mortality.
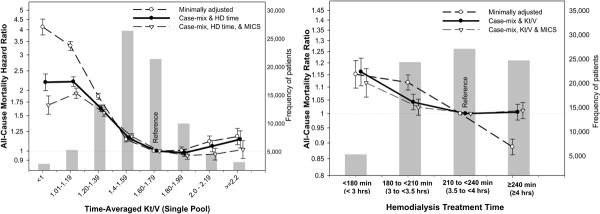
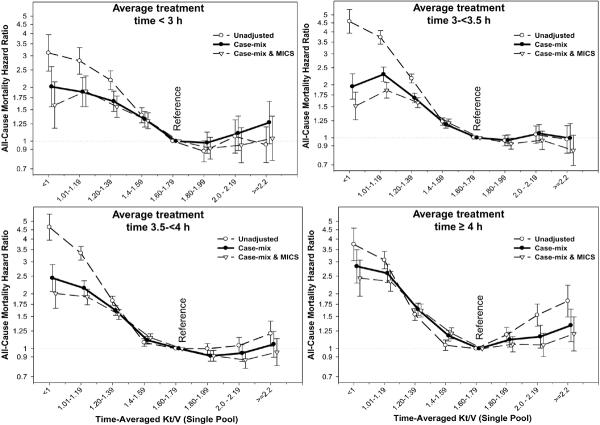
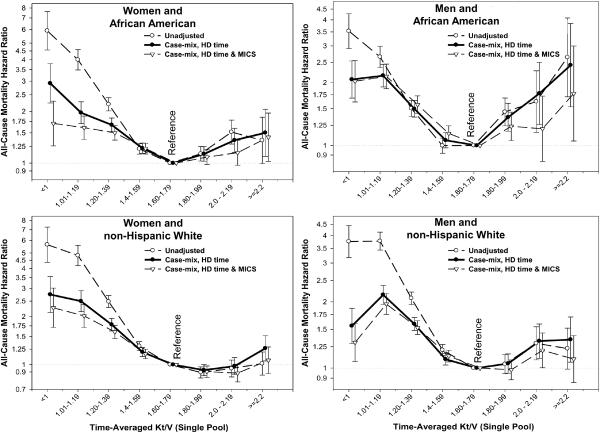
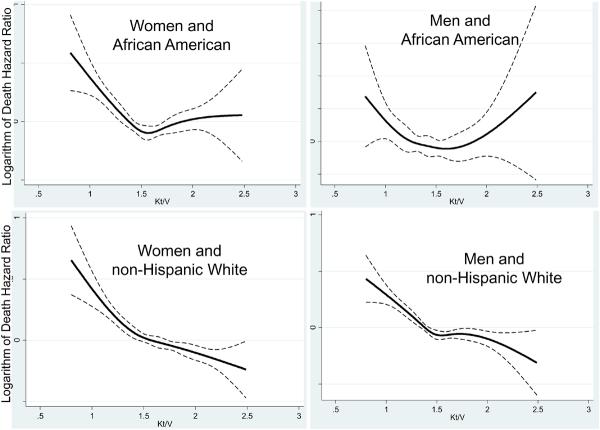
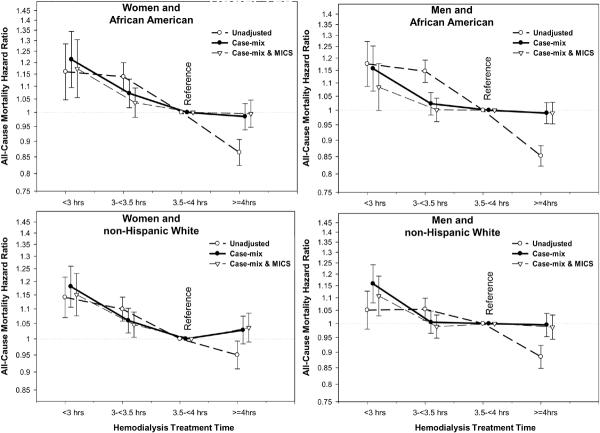
Results: Thrice-weekly treatment time < 3 hours (but > or = 2.5 hours) per HD session compared with > or = 3.5 hours (but < 5 hours) was associated with increased death risk independent of Kt/V dose. The greatest survival gain of higher HD dose was associated with a Kt/V approaching the 1.6-1.8 range, beyond which survival gain was minimal, nonexistent, or even tended to reverse in African American men and those with 4-5 hours of HD treatment. In non-Hispanic white women, Kt/V > 1.8 continued to show survival advantage trends, especially in time-dependent models.
Limitations: Our results may incorporate uncontrolled confounding. Achieved Kt/V may have different associations than targeted Kt/V.
Conclusions: HD treatment dose and time appear to have different associations with survival in different sex or race groups. Randomized controlled trials may be warranted to examine these associations across different racial and demographic groups.
Copyright 2009 National Kidney Foundation, Inc. Published by Elsevier Inc. All rights reserved.
Figures
References
-
- United States Renal Data System United States Renal Data System 2006 Annual Data Report Atlas of Chronic Kidney Disease & End-Stage Renal Disease in the United States. Am J Kidney Dis. 2007;49:1–296. - PubMed
-
- Suri RS, Garg AX, Chertow GM, Levin NW, Rocco MV, Greene T, Beck GJ, Gassman JJ, Eggers PW, Star RA, Ornt DB, Kliger AS. Frequent Hemodialysis Network (FHN) randomized trials: study design. Kidney Int. 2007;71:349–359. - PubMed
-
- Eknoyan G, Beck GJ, Cheung AK, Daugirdas JT, Greene T, Kusek JW, Allon M, Bailey J, Delmez JA, Depner TA, Dwyer JT, Levey AS, Levin NW, Milford E, et al. Effect of dialysis dose and membrane flux in maintenance hemodialysis. N Engl J Med. 2002;347:2010–2019. - PubMed
-
- Gotch FA, Sargent JA. A mechanistic analysis of the National Cooperative Dialysis Study (NCDS) Kidney Int. 1985;28:526–534. - PubMed
-
- Daugirdas JT. The post: pre dialysis plasma urea nitrogen ratio to estimate K.t/V and NPCR: validation. Int J Artif Organs. 1989;12:420–427. - PubMed
Publication types
MeSH terms
Grants and funding
LinkOut - more resources
Full Text Sources
Other Literature Sources
Medical
