. 2009 Oct;17(4):527-40.
doi: 10.1016/j.devcel.2009.09.005.

LRF is an essential downstream target of GATA1 in erythroid development and regulates BIM-dependent apoptosis

Affiliations

LRF is an essential downstream target of GATA1 in erythroid development and regulates BIM-dependent apoptosis

Takahiro Maeda et al. Dev Cell. 2009 Oct.

Abstract

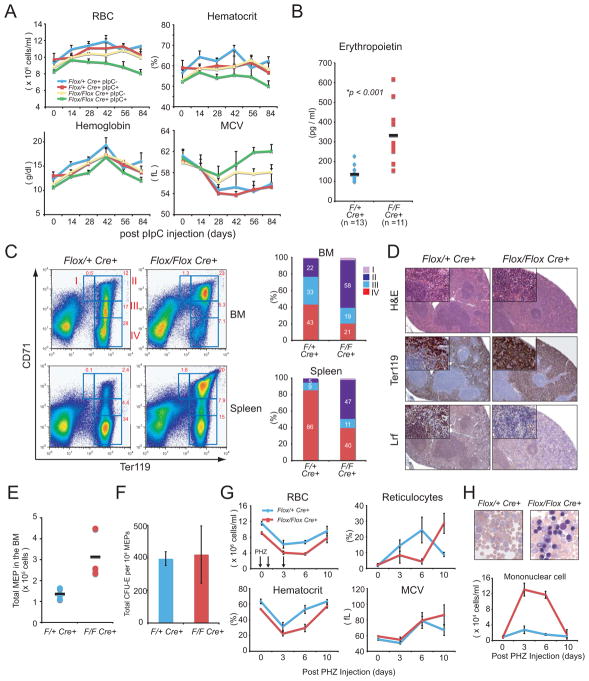
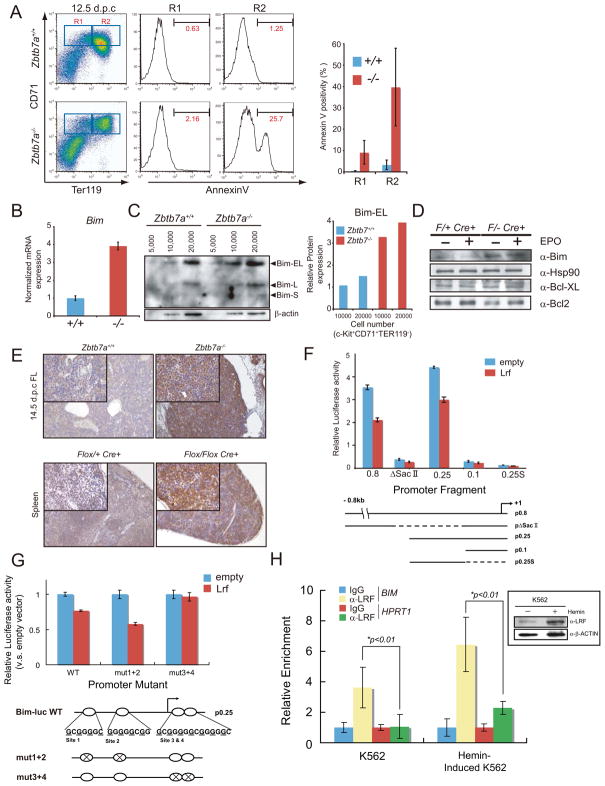
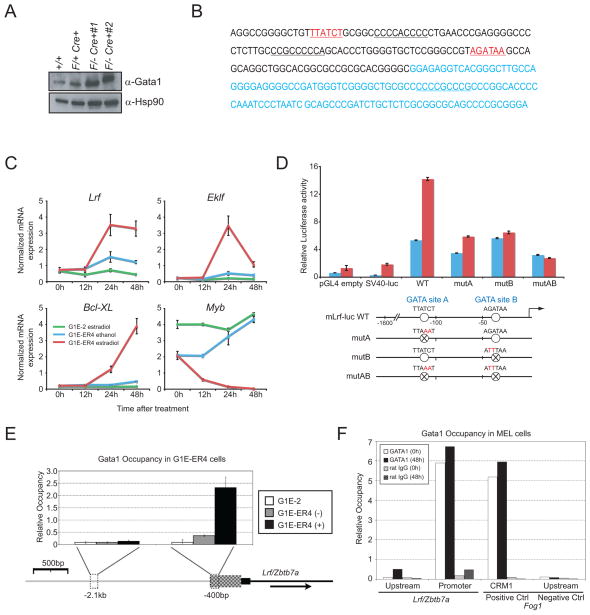
GATA-1-dependent transcription is essential for erythroid differentiation and maturation. Suppression of programmed cell death is also thought to be critical for this process; however, the link between these two features of erythropoiesis has remained elusive. Here, we show that the POZ-Krüppel family transcription factor, LRF (also known as Zbtb7a/Pokemon), is a direct target of GATA1 and plays an essential antiapoptotic role during terminal erythroid differentiation. We find that loss of Lrf leads to lethal anemia in embryos, due to increased apoptosis of late-stage erythroblasts. This programmed cell death is Arf and p53 independent and is instead mediated by upregulation of the proapoptotic factor Bim. We identify Lrf as a direct repressor of Bim transcription. In strong support of this mechanism, genetic Bim loss delays the lethality of Lrf-deficient embryos and rescues their anemia phenotype. Thus, our data define a key transcriptional cascade for effective erythropoiesis, whereby GATA-1 suppresses BIM-mediated apoptosis via LRF.


Figures

Figure 1
Figure 1
Loss of Lrf results in embryonic lethality due to severe anemia. (A) Picture of Zbtb7a+/+ and Zbtb7a−/− 15.5 d.p.c embryos. (B) Hematocrit of Zbtb7a+/+, Zbtb7a+/− and Zbtb7a−/− littermate embryos at 15.5 d.p.c. (C) PB and FL touch preparation from Zbtb7a+/+ and Zbtb7a−/− littermate embryos at 14.5 d.p.c. (D) Total cell numbers per FL were counted for each genotype at different embryonic days. (E) Differential counts on FL cells from Zbtb7a+/+ and Zbtb7−/− littermate embryos. (F) Representative FACS profiles of 12.5 d.p.c and 14.5 d.p.c. FLs from Zbtb7a+/+ and Zbtb7a−/− embryos. Bar graph represents proportions of each population in 12.5 d.p.c. FLs. (G) Colony counts of in vitro differentiated FL precursors derived from 13.5 d.p.c littermate embryos (left). Pictures demonstrate cytospin preparations of CFU-E colonies from Zbtb7a+/+ (top) and Zbtb7a−/− FLs (bottom). (H) Lrf add-back into Zbtb7a−/− erythroblasts rescued impaired differentiation phenotype in vitro. Both Zbtb7a+/+ and Zbtb7a−/− immature erythroblasts (Ter119Gr1B220) were isolated from 12.5 d.p.c FLs and infected with either MSCV-Puro-IRES-GFP (PIG) empty vector or PIG-Lrf vector (Maeda et al., 2005). We then induced erythroid differentiation in vitro and subsequently analyzed for Ter119 expression and cell size (Forward scatter: FSC) by FACS. All error bars indicate s.d.
Figure 2
Figure 2
Ablation of Lrf in the hematopoietic compartment of adult mice results in macrocytic anemia and ineffective erythropoiesis. (A) We examined 4 different groups of mice according to genotype and treatment; Zbtb7aFlox/+Mx1cre+ PBS-treated (blue), Zbtb7aFlox/+Mx1cre+ pIpC-treated (red), Zbtb7aFlox/FloxMx1cre+ PBS-treated (yellow) and Zbtb7aFlox/FloxMx1cre+ pIpC-treated (green). RBC counts, Hematocrit, Hemoglobin and MCV in PB were measured by a hematology analyzer. The average of 5 animals was plotted at each time point with error bars. (B) Serum EPO level was measured one month after pIpC injection. (C) Representative FACS profiles for Ter119 and CD71 expression in BM and Spleen one month after pIpC administration (left). Bar graphs represent percent proportion of each population in BM and Spleen (right). (D) Representative H&E staining of spleen sections (top), demonstrating expansion of red pulp formation in the spleen of pIpC-treated Zbtb7aFlox/FloxMx1cre+ mice (middle panels for Ter119 and bottom panels for Lrf staining). (E) Absolute numbers of megakaryocyte/erythroid progenitors (MEPs) in the BM one month after pIpC administration. Black bars resent the average cell counts of three mice. (F) Erythroid colony forming capacity per 10,000 flow-sorted MEPs was assessed in three independent mice for each genotype. (G) RBC counts, Hematocrit, and MCV were measured in the PB on indicated days after PHZ treatment. Reticulocytes were counted on PB smear slides upon new methylene blue staining. (H) Robust increase of PBMNCs in PHZ-treated, pIpC pre-treated, Zbtb7aFlox/FloxMx1cre+ mice (bottom). Pictures demonstrate Wright-Giemsa staining of PB on day 3. All error bars indicate s.d.
Figure 3
Figure 3
Loss of Lrf leads to increased apoptosis accompanied by high Bim expression. (A) Representative FACS profiles of the triple staining for Ter119, CD71 and Annexin V (left). Bar graph demonstrates the average of % Annexin V positivity in R1 and R2 cell population. (B) Bim mRNA was increased in Zbtb7a−/− FL erythroblasts. c-Kit+CD71+Ter119 erythroblasts were flow sorted and RNA was extracted. cDNA was subsequently synthesized after DNAse treatment and levels of Bim and Hprt1 transcripts were measured by q-RT-PCR. Bar graph represents normalized expression level of Bim mRNA with error bars. (C) Bim protein was up-regulated in Zbtb7a−/− FL erythroblasts. Different numbers of c-Kit+CD71+Ter119 erythroblasts (5,000, 10,000 and 20,000) were directly flow-sorted into protein sample buffer and Western blot was subsequently performed using anti-Bim antibody (left). Bar graph represents normalized Bim protein level to the corresponding β-actin protein levels in c-Kit+CD71+Ter119 erythroblasts from 12.5 d.p.c FLs (right). (D) High Bim protein expression in pIpC-treated Zbtb7aFlox/−Mx1cre+ CD71+ splenic erythroblasts. CD71+splenic erythroblasts were harvested from PHZ treated, pIpC-pretreated, Zbtb7aFlox/+Mx1cre and Zbtb7aFlox/−Mx1cre+ mice. Erythroblasts were then serum starved and subsequently stimulated with EPO. Cells were harvested 10 min after EPO administration and subsequently utilized for experiments. (E) IHC analysis for Bim in FL and Spleen. FLs were isolated from littermate embryos at 14.5 d.p.c. Spleens were collected one month after pIpC treatment. Both low power (x100 magnification) and high power (insets, x400 magnification) are shown. (F) Transrepression assays in 293 cells transfected with various luciferase reporter constructs of the murine proximal Bim promoter. (G) Identification of an essential LRF-binding site in the murine Bim promoter. The putative LRF-binding sites in the Bim promoter were mutagenized and subsequently used for reporter assays. Schematic representations of mutated promoter and expression control for the reporter assay are shown (bottom). Underlined bases of the LRF-binding sites were mutated to Adenine. Luciferase reporter plasmids were transfected into 293 cells. Luciferase activity was measured 24 hours after transfection using the Dual-Luciferase Reporter Assay system. Lrf did not repress the promoter activity of mut3+4 reporter. (H) Quantitive ChIP assay of the BIM promoter both in K562 cells and in induced K562 cells by Hemin. Primer sets were designated to amplify the proximal human BIM promoter and primers designated to the 5′ promoter of HPRT1 were used to detect non specific interactions. The chromatin was sonicated to 200–600bp. A Western blot demonstrates that LRF is upregulated in induced K562 cells by Hemin. All error bars indicate s.d.
Figure 4
Figure 4
Loss of Bim restores erythropoiesis in Zbtb7a−/− FL. (A) Picture of Zbtb7a+/+Bim+/+, Zbtb7a+/+Bim+/− and Zbtb7a+/+Bim+/− 15.5 d.p.c. embryos. (B) Total cell numbers per fetal liver (FL) were counted for each genotype at different embryonic days. Three litters were isolated for each time point and average numbers are presented with standard deviation. (C) Representative FACS profiles of 14.5 d.p.c. FLs from Zbtb7a+/+Bim+/+, Zbtb7a+/+Bim+/− and Zbtb7a+/+Bim+/− 14.5 d.p.c. embryos (D) Bar graph represents proportions of each population in 14.5 d.p.c. FLs. Three embryos were obtained and analyzed for each genotype. (E) Representative FACS profiles of the staining for Annexin V in R2 cell population. (F) Bar graph demonstrates the average of % Annexin V positivity in R1 and R2 cell population. Three FLs were obtained for each genotype. All error bars indicate s.d.
Figure 5
Figure 5
Lrf is a Gata1 downstream target. (A) Western blot for Gata1 in Zbtb7a+/+, Zbtb7aFlox/+Mx1cre and Zbtb7aFlox/−Mx1cre+ CD71+ splenic erythroblasts. Gata1 was abundantly expressed in the absence of Lrf. (B) Sequence of 450 bases of the predicted promoter region of Zbtb7a gene. Consensus EKLF CACCC boxes are underlined; consensus GATA1 binding motifs are depicted in red and underlined; exon 1 sequence is shown in blue. (C) G1E-ER4 is a Gata1-ablated erythroblast line expressing an estradiol-inducible form of GATA1. G1E-ER4 cells and its parental cell line G1E-2 were stimulated with 10−7 M estradiol or ethanol vehicle and RNA was extracted at the indicated time after stimulation. mRNA levels of Lrf, Eklf, Bcl-XL and Myb were measured by q-RT-PCR and normalized to the corresponding Hprt1 mRNA levels. (D) Two GATA elements in the Zbtb7a gene act cooperatively to enhance promoter activity in erythroid cells. (E) Quantitative ChIP assay at the Lrf promoter in Gata1-null parental (G1E-2), uninduced (−), and induced (+) G1E-ER4 cells using anti-Gata1 antibody. The Y-axis shows Gata1 occupancy, relative to a standard curve of the relevant input sample. Below, diagram of the 5′ end of the Zbtb7a gene. Thin black line indicates intron 1; black box represents exon 1; checkered box represents the predicted promoter region, which contains 2 consensus GATA1 binding sites and 3 consensus EKLF CACCC boxes; thin grey line represents the upstream intergenic region. Dashed boxes show regions amplified by quantitative real-time PCR for ChIP. Arrow indicates direction of transcription. (F) Quantitative ChIP assay using anti-GATA1 antibody in MEL cells chemically induced to differentiate for either 0 hours or 48 hours. Data from immunoprecipitations performed with normal rat IgG are shown as controls. All error bars indicate s.d.
Figure 6
Figure 6
Lrf overexpression restores erythroid differentiation in Gata1 deficient erythroblasts. (A) Proportions of Ter119 positive G1E-ER4 cells upon Lrf overexpression without estradiol treatment (left). Representative FACS profiles for Ter119 expression is demonstrated with isotype control (middle). Pictures demonstrate cytospin preparations of empty vector-or Lrf-expressing G1E-ER4 cells (right). (B) Gata1 WT and null ES cells expressing either empty vector or Lrf were induced erythroid differentiation on OP9 stromal layers. Floating hematopoietic cells were harvested and analyzed. Representative FACS profiles of the staining for Annexin V in Ter119 positive cell population (left). Bar graph demonstrates the average of % Annexin V positivity in Ter119 positive cell fraction (right). (C) Sequential analysis for the numbers of floating blood cells derived from Gata1 null ES cells expressing either empty vector (blue) or Lrf (red). (D) May-Giemsa staining of floating erythrocytes (x400 magnification). (E) Proposed model of the role for LRF in terminal erythroid differentiation. We propose that inhibition of apoptosis during erythroid terminal differentiation is dependent on both the EPO/BCL-XL and the LRF/BIM pathways which are activated in response to the transcription factor GATA1. Loss of the tumor suppressor Arf reverted the senescence phenotype in Zbtb7a−/− MEFs (Maeda et al., 2005). All error bars indicate s.d.

References

    1. Bouillet P, Zhang LC, Huang DC, Webb GC, Bottema CD, Shore P, Eyre HJ, Sutherland GR, Adams JM. Gene structure alternative splicing, and chromosomal localization of pro-apoptotic Bcl-2 relative Bim. Mamm Genome. 2001;12:163–168. - PubMed
    1. Bouillet P, Metcalf D, Huang DC, Tarlinton DM, Kay TW, Kontgen F, Adams JM, Strasser A. Proapoptotic Bcl-2 relative Bim required for certain apoptotic responses, leukocyte homeostasis, and to preclude autoimmunity. Science. 1999;286:1735–1738. - PubMed
    1. Cantor AB, Orkin SH. Transcriptional regulation of erythropoiesis: an affair involving multiple partners. Oncogene. 2002;21:3368–3376. - PubMed
    1. Costoya JA, Hobbs RM, Barna M, Cattoretti G, Manova K, Sukhwani M, Orwig KE, Wolgemuth DJ, Pandolfi PP. Essential role of Plzf in maintenance of spermatogonial stem cells. Nat Genet. 2004;36:653–659. - PubMed
    1. Crossley M, Tsang AP, Bieker JJ, Orkin SH. Regulation of the erythroid Kruppel-like factor (EKLF) gene promoter by the erythroid transcription factor GATA-1. J Biol Chem. 1994;269:15440–15444. - PubMed

Publication types

MeSH terms