. 2010 Jan 1;285(1):773-83.
doi: 10.1074/jbc.M109.030726. Epub 2009 Oct 23.

Loss of the Gata1 gene IE exon leads to variant transcript expression and the production of a GATA1 protein lacking the N-terminal domain

Affiliations

Loss of the Gata1 gene IE exon leads to variant transcript expression and the production of a GATA1 protein lacking the N-terminal domain

Eri Kobayashi et al. J Biol Chem. .

Abstract

GATA1 is essential for the differentiation of erythroid cells and megakaryocytes. The Gata1 gene is composed of multiple untranslated first exons and five common coding exons. The erythroid first exon (IE exon) is important for Gata1 gene expression in hematopoietic lineages. Because previous IE exon knockdown analyses resulted in embryonic lethality, less is understood about the contribution of the IE exon to adult hematopoiesis. Here, we achieved specific deletion of the floxed IE exon in adulthood using an inducible Cre expression system. In this conditional knock-out mouse line, the Gata1 mRNA level was significantly down-regulated in the megakaryocyte lineage, resulting in thrombocytopenia with a marked proliferation of megakaryocytes. By contrast, in the erythroid lineage, Gata1 mRNA was expressed abundantly utilizing alternative first exons. Especially, the IEb/c and newly identified IEd exons were transcribed at a level comparable with that of the IE exon in control mice. Surprisingly, in the IE-null mouse, these transcripts failed to produce full-length GATA1 protein, but instead yielded GATA1 lacking the N-terminal domain inefficiently. With low level expression of the short form of GATA1, IE-null mice showed severe anemia with skewed erythroid maturation. Notably, the hematological phenotypes of adult IE-null mice substantially differ from those observed in mice harboring conditional ablation of the entire Gata1 gene. The present study demonstrates that the IE exon is instrumental to adult erythropoiesis by regulating the proper level of transcription and selecting the correct transcription start site of the Gata1 gene.


Figures

FIGURE 1.
FIGURE 1.
Establishment of the IEflox allele. A, the wild-type Gata1 locus, Gata1.05flox, IEflox, and ΔIE allele. Boxes represent untranslated (white) and coding (black) exons and triangles represent loxP sites. The location of the probe used to verify the recombination efficiency is shown as a black bar. The EcoRI and EcoRV restriction sites are indicated as red and blue vertical lines, respectively. B, wild-type and Gata1ΔIE/Y embryos at E9.5.
FIGURE 2.
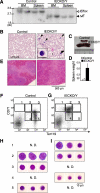
FIGURE 2.
Conditional deletion of the IE exon causes dyserythropoiesis. A, Southern blotting analysis of Gata1IECKO/Y and control mice. Genomic DNAs were digested with EcoRI and EcoRV restriction enzymes, followed by hybridization with the probe corresponding to the upstream region of the IE exon (shown in Fig. 1A, black bar). Arrowheads indicate the bands corresponding to the IEflox allele (2.9 kb, white arrowhead) and the ΔIE allele (2.5 kb, black arrowhead), respectively. BM, bone marrow. Two independent mice from day 5 were utilized for each genotype. B, Wright-Giemsa staining of peripheral blood smears from day 40. Note that for Gata1IECKO/Y mice a considerable number of erythroblasts appeared on the film (right panel, arrowheads). An erythroblast at high magnification is shown in the inset. Scale bars represent 10 μm. C and D, Gata1IECKO/Y mice displayed massive splenomegaly. A representative example is shown in C. The weights of Gata1IECKO/Y spleens were ∼6-fold larger than those of control mice (Gata1IECKO/Y mice, n = 10; control mice, n = 9; p < 0.0001). E, histological analysis of spleens. Note that the splenic architecture was destroyed due to the massive expansion of erythroid and megakaryocytic cells. F and G, flow cytometric analysis of erythroid differentiation in control (F) and Gata1IECKO/Y (G) bone marrow cells. H and I, morphological assessment of cells isolated from bone marrow recovered from control (H) and Gata1IECKO/Y (I) mice using flow cytometric cell sorting. The column numbers correspond to the regions shown in F and G. N.D., not done.
FIGURE 3.
FIGURE 3.
The IE exon is important for adult megakaryopoiesis. A, CD41 and CD61 expression on the bone marrow cells recovered from control (upper panel) and Gata1IECKO/Y (lower panel) mice. The frequency of CD41+CD61+ cells was reproductively increased in Gata1IECKO/Y mice compared with control mice. B, acetylcholine esterase staining of spleen sections from control (upper panel) and Gata1IECKO/Y (lower panel) mice.
FIGURE 4.
FIGURE 4.
The expression of Gata1 mRNA was retained in the erythroblasts of Gata1IECKO/Y mice. A, semi-quantitative RT-PCR analysis of bone marrow cells using a primer set from the second and sixth exon sequences to amplify the entire coding sequence of the Gata1 gene. Amplification cycles are shown. B, Gata1 gene expression in bone marrow cells analyzed by qRT-PCR using a TaqMan probe that recognizes the boundary sequence corresponding to the forth and fifth exons of the Gata1 gene. Four control and six Gata1IECKO/Y mice were utilized for this experiment. The mean value of control mice was set to one. C, erythroid and megakaryocytic Gata1 gene expression was assessed by qRT-PCR using the same TaqMan probe as in B. Cells possessing the indicated lineage markers were independently isolated by MACS from three mice for each genotype. The mean value of wild-type (WT) CD71+ cells was set to one. Note that Gata1 expression in CD41+ cells was significantly reduced in Gata1IECKO/Y bone marrow, whereas that in CD71+ cells was preserved.
FIGURE 5.
FIGURE 5.
Alternative first exons used for the expression of Gata1 transcripts in erythroid cells in Gata1IECKO/Y mice. A, schematic illustration of the positions of currently identified promoters of the Gata1 gene. Start codons (ATG) in the second and third exons are indicated. B, 5′-RACE analysis of Gata1 mRNA. The fast and slow migrating bands observed in Gata1IECKO/Y mice are indicated by gray and black arrowheads, respectively. C, the 5′-UTR cDNA sequences of Gata1 transcripts containing the IE, IEb/c, or IEd exons. Arrowheads indicate the TS sites, with the most utilized TS sites emphasized by black arrowheads. The number of isolated clones with the same TS site is shown beside the arrowheads. The consensus initiator sequences (YYANWYY) are underlined. D, semi-quantitative RT-PCR analysis of specific 5′-UTR containing Gata1 transcripts from bone marrow cells. Primer sets designed for the amplification of sequences corresponding to the entire coding sequences, including the indicated exon sequences, were utilized. E, qRT-PCR analysis of specific 5′-UTR containing Gata1 transcripts from erythroid and megakaryocytic cells. The same samples as used in Fig. 4C were used in this experiment. Note that variant transcripts were abundantly expressed in CD71+ cells from Gata1IECKO/Y mice. The mean value of the transcripts in Gata1IECKO/Y CD71+ cells was set to one. F, ChIP-qPCR analysis of the histone H3 lysine K4 methylation level in the Gata1 first exon/promoter regions. An aliquot of each sample shown in the figure was used for immunoprecipitation. The values were normalized against the histone H3 occupancy on each promoter. White, gray, and black bars represent control mice, phenylhydrazine-treated control mice with hematocrit values less than 33%, and Gata1IECKO/Y mice, respectively. The values exhibiting a significant change from those of control mice are indicated by asterisks (*, p < 0.05).
FIGURE 6.
FIGURE 6.
In Gata1IECKO/Y mice, GATA1 with a truncated N terminus is expressed alternatively to full-length GATA1. A, immunoblotting analysis of GATA1 from bone marrow. A bone marrow sample recovered from Gata1G1.05/Y mice rescued by transgenic expression of ΔNT-GATA1 (indicated as ΔNTR) (30) and the cell lysate of murine erythroleukemia cells (MEL) were employed as markers of ΔNT-GATA1 (black arrowhead) and full-length GATA1 (white arrowheads), respectively. Of great interest, in Gata1IECKO/Y bone marrow, bands of a molecular weight equivalent to that of ΔNT-GATA1 were detected with C20 antibody, whereas the N6 antibody did not recognize full-length GATA1 protein. B, immunohistochemical analysis of spleen sections from control mice (left panels) and Gata1IECKO/Y mice (right panels) using N6 (bottom panels) and C20 (top panels) anti-GATA1 antibodies.

References

    1. Ferreira R., Ohneda K., Yamamoto M., Philipsen S. (2005) Mol. Cell. Biol. 25, 1215–1227 - PMC - PubMed
    1. Lowry J. A., Mackay J. P. (2006) Int. J. Biochem. Cell Biol. 38, 6–11 - PubMed
    1. Fujiwara Y., Browne C. P., Cunniff K., Goff S. C., Orkin S. H. (1996) Proc. Natl. Acad. Sci. U.S.A. 93, 12355–12358 - PMC - PubMed
    1. Gutiérrez L., Tsukamoto S., Suzuki M., Yamamoto-Mukai H., Yamamoto M., Philipsen S., Ohneda K. (2008) Blood 111, 4375–4385 - PubMed
    1. Shivdasani R. A., Fujiwara Y., McDevitt M. A., Orkin S. H. (1997) EMBO J. 16, 3965–3973 - PMC - PubMed

Publication types

MeSH terms

LinkOut - more resources