

Maximization of negative correlations in time-course gene expression data for enhancing understanding of molecular pathways
- PMID: 19854949
- PMCID: PMC2800212
- DOI: 10.1093/nar/gkp822
Maximization of negative correlations in time-course gene expression data for enhancing understanding of molecular pathways
Abstract
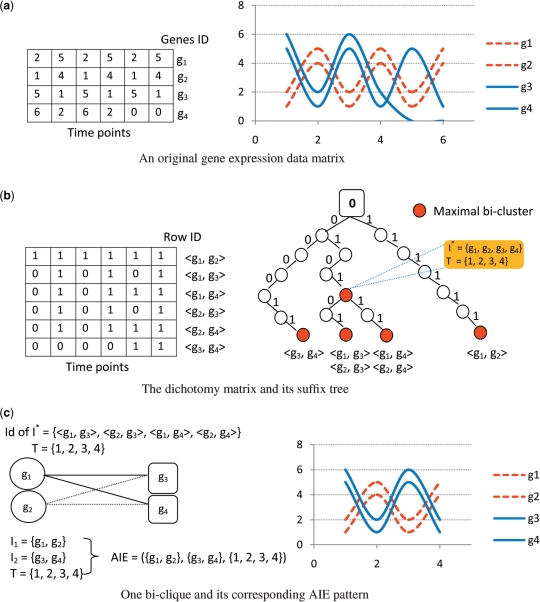
Positive correlation can be diversely instantiated as shifting, scaling or geometric pattern, and it has been extensively explored for time-course gene expression data and pathway analysis. Recently, biological studies emerge a trend focusing on the notion of negative correlations such as opposite expression patterns, complementary patterns and self-negative regulation of transcription factors (TFs). These biological ideas and primitive observations motivate us to formulate and investigate the problem of maximizing negative correlations. The objective is to discover all maximal negative correlations of statistical and biological significance from time-course gene expression data for enhancing our understanding of molecular pathways. Given a gene expression matrix, a maximal negative correlation is defined as an activation-inhibition two-way expression pattern (AIE pattern). We propose a parameter-free algorithm to enumerate the complete set of AIE patterns from a data set. This algorithm can identify significant negative correlations that cannot be identified by the traditional clustering/biclustering methods. To demonstrate the biological usefulness of AIE patterns in the analysis of molecular pathways, we conducted deep case studies for AIE patterns identified from Yeast cell cycle data sets. In particular, in the analysis of the Lysine biosynthesis pathway, new regulation modules and pathway components were inferred according to a significant negative correlation which is likely caused by a co-regulation of the TFs at the higher layer of the biological network. We conjecture that maximal negative correlations between genes are actually a common characteristic in molecular pathways, which can provide insights into the cell stress response study, drug response evaluation, etc.
Figures


References
-
- Segal E, Wang H, Koller D. Discovering molecular pathways from protein interaction and gene expression data. Bioinformatics. 2003;19(Suppl. 1):i264–i271. - PubMed
-
- Cho RJ, Campbell MJ, Winzeler EA, Steinmetz L, Conway A, Wodicka L, Wolfsberg TG, Gabrielian AE, Landsman D, Lockhart DJ, et al. A genome-wide transcriptional analysis of the mitotic cell cycle. Mol. Cell. 1998;2:65–73. - PubMed
-
- Madeira SC, Oliveira AL. Biclustering algorithms for biological data analysis: a survey. IEEE/ACM Trans. Computat. Biol. Bioinform. 2004;1:24–45. - PubMed
-
- Aguilar-Ruiz JS. Shifting and scaling patterns from gene expression data. Bioinformatics. 2005;21:3840–3845. - PubMed
-
- Segal E, Shapira M, Regev A, Pe’er D, Botstein D, Koller D, Friedman N. Module networks: identifying regulatory modules and their condition-specific regulators from gene expression data. Nat. Genet. 2003;34:166–176. - PubMed
Publication types
MeSH terms
Substances
LinkOut - more resources
Full Text Sources
Molecular Biology Databases
