. 2009 Nov 10;106(45):19108-13.
doi: 10.1073/pnas.0904343106. Epub 2009 Oct 23.

Elevating the frequency of chromosome mis-segregation as a strategy to kill tumor cells

Affiliations

Elevating the frequency of chromosome mis-segregation as a strategy to kill tumor cells

Aniek Janssen et al. Proc Natl Acad Sci U S A. .

Abstract

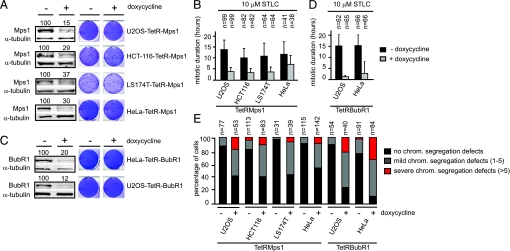
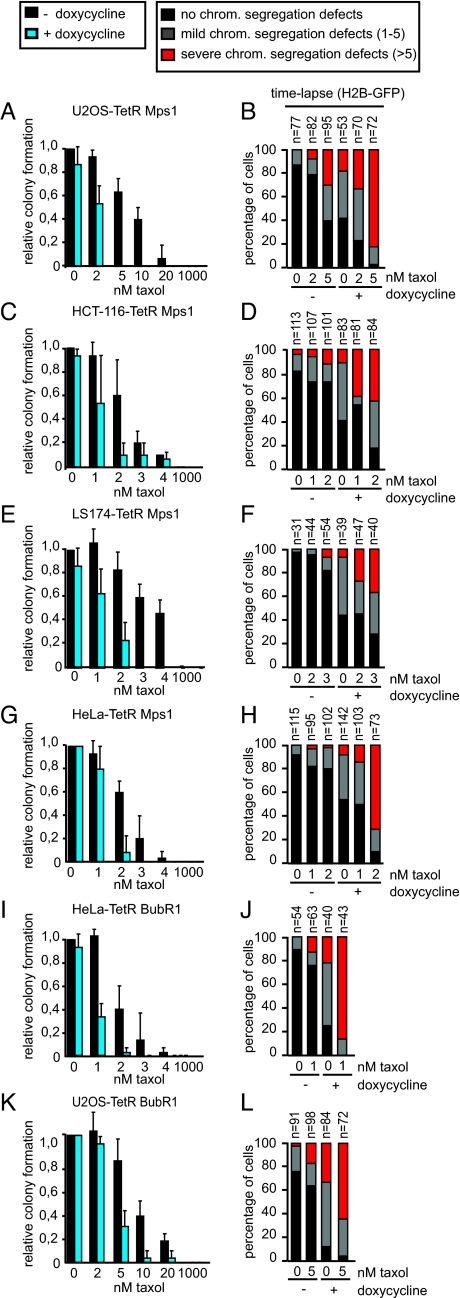
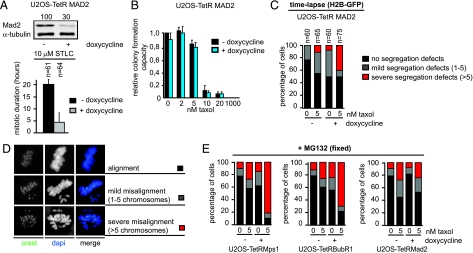
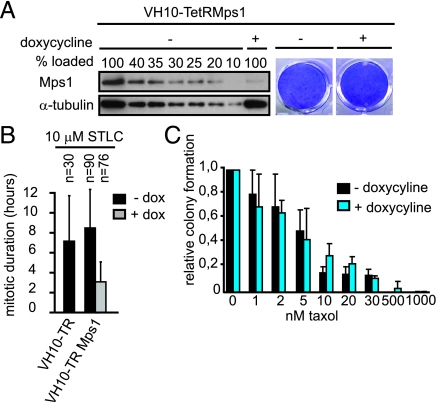
The mitotic checkpoint has evolved to prevent chromosome mis-segregations by delaying mitosis when unattached chromosomes are present. Inducing severe chromosome segregation errors by ablating the mitotic checkpoint causes cell death. Here we have analyzed the consequences of gradual increases in chromosome segregation errors on the viability of tumor cells and normal human fibroblasts. Partial reduction of essential mitotic checkpoint components in four tumor cell lines caused mild chromosome mis-segregations, but no lethality. These cells were, however, remarkably more sensitive to low doses of taxol, which enhanced the amount and severity of chromosome segregation errors. Sensitization to taxol was achieved by reducing levels of Mps1 or BubR1, proteins having dual roles in checkpoint activation and chromosome alignment, but not by reducing Mad2, functioning solely in the mitotic checkpoint. Moreover, we find that untransformed human fibroblasts with reduced Mps1 levels could not be sensitized to sublethal doses of taxol. Thus, targeting the mitotic checkpoint and chromosome alignment simultaneously may selectively kill tumor cells by enhancing chromosome mis-segregations.


Conflict of interest statement

The authors declare no conflict of interest.

Figures

Fig. 1.
Fig. 1.
Partial inactivation of Mps1 or BubR1 leads to chromosome segregation defects but fails to compromise tumor cell viability. (A and C) Left: Indicated cell lines, treated without (-) and with (+) doxycycline (dox) for 3 days, were immunoblotted for Mps1 or BubR1 and α-tubulin. Values above blots represent relative amount of Mps1 or BubR1 protein levels. Right: Colony formations of indicated cell lines, treated with and without dox for 11 days. (B and D) Live cell analysis (DIC) of the mean mitotic duration (+SD) in the presence of 10μΜ STLC of indicated cell lines treated with or without doxycycline for 3 days. Mitotic duration was determined as the time from nuclear envelope breakdown (NEB) to the first attempt of cytokinesis (membrane blebbing). n = amount of cells filmed per condition. (E) Quantification of time-lapse movies as performed in representative images. Dox was added 3 days before filming. n = amount of cells filmed per condition.
Fig. 2.
Fig. 2.
Low doses of taxol reduce the viability of Mps1 or BubR1 depleted tumor cells. (A, C, E, G, I, and K). Quantification of colony formations of indicated cell lines treated with and without dox for 11 days. Indicated taxol concentrations were added 1 day after dox administration. Colony formation capacity of control cells (no taxol treatment) was set at 1. Average of three independent experiments is shown. (B, D, F, H, J, and L). Quantification of time-lapse movies performed as in Fig. 1E. Indicated taxol concentrations were added 1 h before filming. n = amount of cells filmed.
Fig. 3.
Fig. 3.
Chromosome alignment dysfunction in Mps1- or BubR1-depleted cells enhances cell death upon taxol [low] treatment. (A) Top: U2OS-TetRMad2 cells that were treated with and without dox were immunoblotted for Mad2 and α-tubulin. Values indicate relative percentage of Mad2 levels. Bottom: Live cell analysis of the mitotic duration of U2OS-TetRMad2 cells treated and measured as in Fig. 1B. (B) Quantification of colony formations analyzed as in Fig. 2. (C) Quantification of anaphase progression as in Fig. 1E. n = amount of cells filmed. (D) Immunofluorescence images of cells with different chromosome alignment phenotypes after 90 min addition of MG132. Centromeres (CREST) are in green and DNA (DAPI) is in blue. ‘Alignment’, ‘Mild misalignment’ or ‘Severe misalignment’ indicate cells with 0, 1–5, or more than 5 chromosomes not aligned on the metaphase plate, respectively. (E) The indicated cell lines were treated with or without dox for 3 days and 1 h before MG132 addition indicated taxol concentrations were added. n = amount of cells analyzed per condition.
Fig. 4.
Fig. 4.
Taxol induced cell death is not enhanced in partial Mps1 depleted immortalized fibroblasts. (A) VH10-TetRMps1 cells that were treated with and without dox for 4 days were immunoblotted for Mps1 and α-tubulin. Indicated amounts of untreated control sample were loaded to determine knockdown of Mps1 in dox treated sample. (B) Live cell analysis of the mitotic duration of indicated cell lines treated and measured as in Fig. 1B. (C) Quantification of colony formations as in Fig. 2. Average of three independent experiments is shown. (D) Quantification of time-lapse analysis (DIC) of chromosome segregation in anaphase. n = amount of cells filmed.

References

    1. Cohen J. Sorting out chromosome errors. Science. 2002;296:2164–2166. - PubMed
    1. Heim Sa, Mitelman F. Cancer Cytogenetics. New York: Wiley Liss Inc.; 1995.
    1. Lengauer C, Kinzler KW, Vogelstein B. Genetic instabilities in human cancers. Nature. 1998;396:643–649. - PubMed
    1. Weaver BA, Cleveland DW. Does aneuploidy cause cancer? Curr Opin Cell Biol. 2006;18:658–667. - PubMed
    1. Kops GJ, Weaver BA, Cleveland DW. On the road to cancer: Aneuploidy and the mitotic checkpoint. Nat Rev Cancer. 2005;5:773–785. - PubMed

Publication types

MeSH terms

LinkOut - more resources