. 2009 Mar;7(3):e1000074.
doi: 10.1371/journal.pbio.1000074. Epub 2009 Mar 31.

A computational framework for ultrastructural mapping of neural circuitry

Affiliations

A computational framework for ultrastructural mapping of neural circuitry

James R Anderson et al. PLoS Biol. 2009 Mar.

Abstract

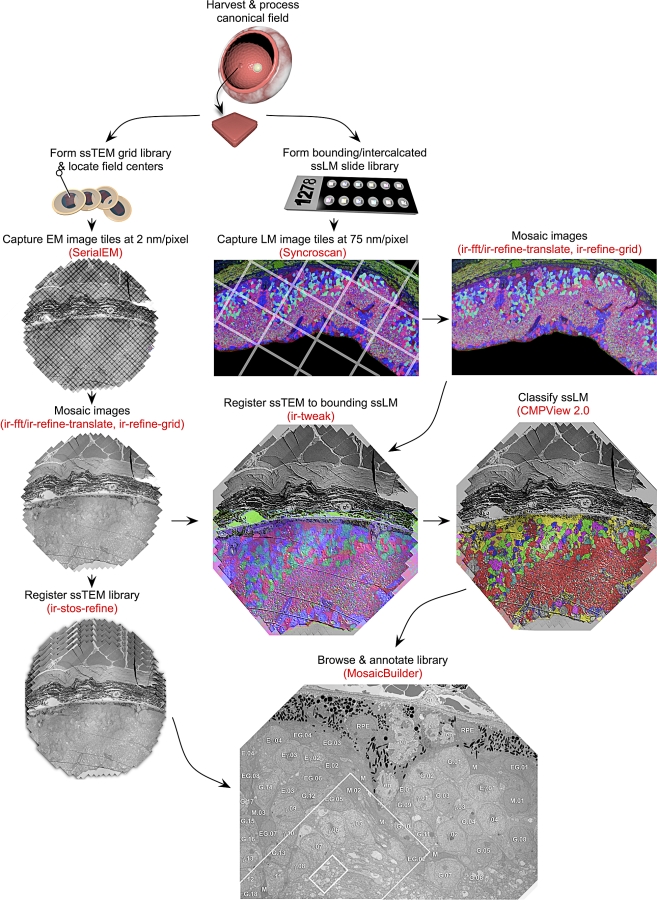
Circuitry mapping of metazoan neural systems is difficult because canonical neural regions (regions containing one or more copies of all components) are large, regional borders are uncertain, neuronal diversity is high, and potential network topologies so numerous that only anatomical ground truth can resolve them. Complete mapping of a specific network requires synaptic resolution, canonical region coverage, and robust neuronal classification. Though transmission electron microscopy (TEM) remains the optimal tool for network mapping, the process of building large serial section TEM (ssTEM) image volumes is rendered difficult by the need to precisely mosaic distorted image tiles and register distorted mosaics. Moreover, most molecular neuronal class markers are poorly compatible with optimal TEM imaging. Our objective was to build a complete framework for ultrastructural circuitry mapping. This framework combines strong TEM-compliant small molecule profiling with automated image tile mosaicking, automated slice-to-slice image registration, and gigabyte-scale image browsing for volume annotation. Specifically we show how ultrathin molecular profiling datasets and their resultant classification maps can be embedded into ssTEM datasets and how scripted acquisition tools (SerialEM), mosaicking and registration (ir-tools), and large slice viewers (MosaicBuilder, Viking) can be used to manage terabyte-scale volumes. These methods enable large-scale connectivity analyses of new and legacy data. In well-posed tasks (e.g., complete network mapping in retina), terabyte-scale image volumes that previously would require decades of assembly can now be completed in months. Perhaps more importantly, the fusion of molecular profiling, image acquisition by SerialEM, ir-tools volume assembly, and data viewers/annotators also allow ssTEM to be used as a prospective tool for discovery in nonneural systems and a practical screening methodology for neurogenetics. Finally, this framework provides a mechanism for parallelization of ssTEM imaging, volume assembly, and data analysis across an international user base, enhancing the productivity of a large cohort of electron microscopists.


Conflict of interest statement

Competing interests. Robert E. Marc is a principal of Signature Immunologics. All other authors declare no other competing interests.

Figures

Figure 1
Figure 1. Neuronal Elements for Building Networks
(A) Five-element micronetwork involving one AC (A) mediating cross talk between two vertical channels (i, j) with BCs (B) synaptically driving GCs (G). There are eight discrete AC connections (0–7), and the network can be configured in 90 formal motifs, at least 40 of which are of biological significance. Solid dots and arrows are excitatory; open dots and arrows are inhibitory.
Figure 2
Figure 2. Voronoi Tiling of GC Classes in the Rabbit Retina
Panels 1–15 represent GC or AC groups defined by CMP [5]. The bottom panel is the aggregate GC pattern. Each class forms its own independent tiling. Class 6 (red) is the most orderly. Class 9 (yellow) is the rarest and defines a canonical field for the GC cohort, containing three members of the class. Class 14 (cyan) is the densest and is the starburst displaced AC population. The canonical field superimposed on the entire GC cohort (green) captures >100 cells and guarantees a robust sample of all network types. Modified from Marc and Jones [5].
Figure 3
Figure 3. The Workflow for the ssTEM Ultrastructural Circuitry Framework
Parallel serial section grid (ssTEM) and slide (ssLM) libraries are built. The ssLM libraries define either the bounds of the canonical field or are intercalated. Each library is acquired as a set of tiles mosaicked by ir-tools. ssLM and ssTEM mosaics are registered by ir-tweak and ssTEM volumes built with ir-stos applications. CMP classified ssLM imagery is merged with the volume to tag neurons and processes. The volumes are browsed with MosiacBuilder/Viking for process tracking and annotation.
Figure 4
Figure 4. Distortions in Overlapping Tile Regions Visualized on Film Capture of ssTEM Data
A typical low magnification (3,000×) field for synaptic screening in the rabbit inner plexiform layer was captured on a Hitachi H-600 with film images at ≈25% overlap. (A and B) represent part of the overlapping fields with slightly different densities due to the auto-exposure of different images. (C and D) represent the difference of (A and B) after translational/rotational best alignments for two regions (circles 1 and 2). When imagery in circle 2 is aligned best (C) the regions in circle 1 are shifted and have a higher image dispersion. The same is true when imagery in circle 1 is aligned best (D). The quality of alignment is quantified by normalized intensity histograms of corresponding patches. When spots are well-aligned (blue) the histograms are narrow, when poorly aligned (yellow) the intensity variance is high. The two spots are 6 μm apart. The histograms are peak normalized pixel number (ordinate) versus pixel value (abscissa, 0–255). Arrows indicate various ribbon and conventional synapses.
Figure 5
Figure 5. Recovery of Distortion Errors in Tile Overlaps with ir-fft and ir-grid-refine
(A and B) are mirror images of the transparent overlays of fully overlapping regions of two tiles, both with best alignment centers on a large mitochondrion (white spot). (A) was auto-registered by ir-translate and many membranes appear as double images (arrows) due to nonlinear image distortions between the image pairs. (B) was registered with ir-grid-refine yielding improved membrane definition, even at very low magnification (resolution is about 5 nm/pixel, which accounts for the blurring). This is a worst-case scenario. With higher resolutions (more pixels) recovery is even more effective. The inset panels are high-pass 3 × 3-pixel filtered patches of the same region, showing severe moiré defects in (A). Scale = 2 μm.
Figure 6
Figure 6. Representative Tile Overlaps Randomly Selected from a 1,000-Tile Array
(A) A randomly selected region of rabbit retinal inner plexiform layer displaying parts of section number 105 containing 28 overlapping tiles. The overlaps are invisible at this magnification. Image width = 46.6 μm, M Müller cell processes. (B) Randomly selected boxed region from (A) containing tile overlaps, width = 4.76 μm. Arrows indicate a corner region among four tiles. A pair of vesicles (circled) is enlarged in the inset at left showing a misalignment between upper and lower tiles (arrows) corresponding to 7.8 nm or roughly one-third vesicle. The four corner region (arrows) is enlarged in the inset at right, showing no significant misalignment. The shaded margins of each tile are due to image processing edge enhancements. Most tiles have no measurable misalignment. AC, AC terminal.
Figure 7
Figure 7. Auto-Registration of ssLM Image Tiles with ir-translate and ir-grid-refine
A thin 200-nm section was probed with anti-AGB IgGs after excitation of the rabbit retinal GC layer [60], visualized by silver-intensified immunogold detection [54], captured on a SyncroscanRT montaging system (182 nm/pixel), and aligned with Syncroscan software (A and C) and ir-translate/ir-grid-refine (B and D). At low magnification, both images appear perfect, but at near pixel level, many small defects emerge in the Syncroscan-aligned mosaic (arrows in [A and C]) that include 200–2,000-nm image shifts and image blurring (box). By using the raw image tiles and their metadata, ir-translate and ir-grid-refine create defect-free mosaics. While the image shifts shown in (A) are irrelevant (indeed invisible) for image display, they are highly corrupting in mathematically sensitive procedures such as clustering and multimodal alignments with ssTEM datasets. (A and B) are bright-field images and (C and D) are contrast-stretched Laplacian filtered images that enhance discontinuities and clearly show alignment defects. The circle in image (D) represents a lysosome of approximately 200 nm diameter. Its contrast is better preserved in the ir-translate and ir-grid-refine mosaic. Scale = 20 μm.
Figure 8
Figure 8. Registering ssTEM Image Tiles with ir-tweak
The entire image represents two windows of the ir-tweak interface. The top window shows two serial sections from a manual film capture with tiles in different orientations (arrows), the left being the fixed and the right the moving or warped image. Successive control points (dots) entered on the fixed image by the user are predictively placed on the moving image based on the model calculated from all previous points, with a thin-plate spline strategy for accommodating local warps. The bottom panel shows the superimposed fixed (blue) and warped (orange) in real-time.
Figure 9
Figure 9. A Frame from a QuickTime Movie of a Volume Slice through a Mouse Retinal Microneuroma
The microneuroma is 27 μm long and 16 μm wide at mid-length. The volume slice spans 45 sections, 90 nm each for a thickness of 4 μm. The original data were scanned from manually acquired TEM film images, aligned using ir-stos tools, and converted to a smaller movie using ir-stom (slice-to-movie), which generates 90 frames. Each slice is cropped such that only pixels with valid mapping onto every slice in the volume are kept. The raw serial image output from ir-stom was imported into QuickTime Pro v7 and saved as a movie. See Video S1.
Figure 10
Figure 10. Automatic Neural Volume Assembly
(A and B) automatically mosaicked slice 1 (A) and 10 (B) from an automatically registered 20-slice volume. Scale, 10 μm. (C and D) Slices 5 (C) and 9 (D) from the boxed regions in (A and B) showing that definition of reciprocal synapse identity requires ssTEM data. AC process A1 receives excitatory synaptic ribbon (r3) input from BC terminal B1 in (C), but does not show a feedback synapse until slice 9 (D). Similarly, AC process A11 show a feedback synapse in slice 5 (C) but does not receive excitatory synaptic ribbon (r4) input from BC terminal B1 until slice 9 (D). Arrows denotes synaptic polarity. Scale, 1 μm. (E) Partial summary of connections from markup of the volume. BC B1 drives five GABAergic (γ) ACs with reciprocal feedback and five glycinergic (gly) ACs. Four putative γ ACs provide feedforward inhibition onto some of the gly AC profiles. The origin of those processes is yet unknown.
Figure 11
Figure 11. Automatic Registration of Canonical Scale Mosaics
The left two columns are six 1,000+ tile mosaics from a series of over 120 horizontal plane 70-nm sections of the rabbit inner nuclear layer (sections 1, 20, 40, 61, 80, 103) spanning over 9 μm. Each mosaics is 250 μm wide. The middle column shows mosaics 20, 40, 61, 80, 103 with a colored overlay of the tile adjustment mesh (the true subtile mesh is much finer). The high contrast version of the mosaic 20 mesh shows that the bounding and bisecting lines only slight deviations from linearity due to slice-to-slice distortions. However, these do not accumulate. The arrow indicates a patch of the true mesh density. The right column (53 μm wide) is a magnified region of each slice showing the excellent cell-to-cell and subcellular alignment achieved by purely automatic image registration with ir-tools.
Figure 12
Figure 12. Fusion of ssLM CMP and ssTEM Data
The mouse retinal microneuroma data shown in previous figures are comprised of the initial section in the ssTEM set (A), a set of four bounding 90-nm ssLM sections visualized by IgG γ, IgG G, IgG E, and IgG τ, all registered by ir-tweak, mapped as γGE :: rgb (B) and γτE :: rgb (C) triplets, converted by cluster analysis in CMPView into a classified theme map of nine discrete superclasses (see text).
Figure 13
Figure 13. Fusion of ssLM CMP and ssTEM Data at the Synaptic Scale
(A) A 20-μm wide strip from a 750-μm wide mouse retinal dataset of the inner plexiform layer extending from the AC layer (top) to the GC layer (bottom). The color map is a γGτ :: rgb mapping visualized as a transparency overlay onto the TEM data. Scale 10 μm. (B) The synaptic terminal of an ON cone BC (as identified by its signature and the region of the inner plexiform layer from which it was sampled, outlined in [A]). Four synapses are marked by arrows. The shaft of each arrow originates in the presynaptic process and the arrowhead lie in the target process. The BC is presynaptic to two profiles at a ribbon synapse (r) and postsynaptic to profiles γ1 and G1. (C) The ssLM CMP overlay, showing the characteristic blue τ+ signature of BCs, two different red GABAergic profiles (γ1 and γ2), and the green glycinergic profile (G1). (D) Enlargement of the classic BC ↔ AC GABAergic reciprocal feedback synapse. Scale 1 μm for both (B) and (C), and 400 nm for (D).
Figure 14
Figure 14. Browsing 30-GB Datasets with MosaicBuilder
For this image, 1,001 TEM images were captured at 5,000× (2.18 nm/pixel) with SerialEM, tiled into a single mosaic dataset by ir-translate and ir-grid-refine, and visualized with MosaicBuilder. The overlap of each image with its neighbors is shown in (A) and the entire seamless image visualized in (B). The polygonal region in (B) is visualized in (C) simply by “zooming” in MosaicBuilder and the classifications obtained in Figure 11 annotated onto the initial section of the dataset. The rectangles in (C) are further enlargements that extend to the synaptic level. See Video S3.
Figure 15
Figure 15. The Retinal CN Mapping Framework
Canonical fields of rabbit retina are being sectioned from the GC to the AC layers at 70 nm and tiled mosaics acquired for volume assembly. Bounding the ssTEM set are classified sets of GCs (top) and ACs (bottom) whose processes enter the field and can be tagged and tracked. The GC patch is shown as a theme map and the AC patch as a γ.AGB.E :: rgb mapped image. At 5,000× it is possible to unambiguously identify both conventional and ribbon synapses as well as most gap junctions that exceed ≈200 nm in lateral extent. As CMP can be performed on sections as thin as 40 nm, selected molecular signals can be intercalated into ssTEM sets without significant disruption of volume builds by saving spaced sections for CMP, using them if needed, or reinserting them as ssTEM elements if not.

References

    1. Sporns O, Tononi G, Kötter R. The human connectome: a structural description of the human brain. PLoS Comput Biol. 2005;1:e42. doi: 10.1371/journal.pcbi.0010042. - DOI - PMC - PubMed
    1. Lichtman JW, Livet J, Sanes JR. A technicolour approach to the connectome. Nat Rev Neurosci. 2008;9:417–422. - PMC - PubMed
    1. MacNeil MA, Heussy JK, Dacheux RF, Raviola E, Masland RH. The shapes and numbers of amacrine cells: matching of photofilled with Golgi-stained cells in the rabbit retina and comparison with other mammalian species. J Comp Neurol. 1999;413:305–326. - PubMed
    1. MacNeil MA, Heussy JK, Dacheux RF, Raviola E, Masland RH. The population of bipolar cells in the rabbit retina. J Comp Neurol. 2004;472:73–86. - PubMed
    1. Marc RE, Jones BW. Molecular phenotyping of retinal ganglion cells. J Neurosci. 2002;22:413–427. - PMC - PubMed

Publication types