

Review
doi: 10.1371/journal.pcbi.1000481.
Epub 2009 Oct 26.
Computational resources in infectious disease: limitations and challenges
Affiliations
- PMID: 19855825
- PMCID: PMC2756590
- DOI: 10.1371/journal.pcbi.1000481
Item in Clipboard
Review
Computational resources in infectious disease: limitations and challenges
PLoS Comput Biol.
2009 Oct.
No abstract available
Conflict of interest statement
The authors have declared that no competing interests exist.
Figures
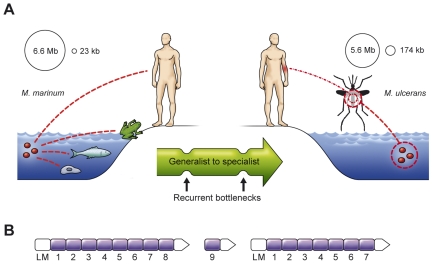
(A) Recent evolution of the specialist human pathogen M. ulcerans from the aquatic generalist pathogen M. marinum. (B) Arrangement of the three M. ulcerans plasmid–encoded repeated virulence genes (arrows from left to right: mlsA1 [51 kb], mlsA2 [7.6 kb], mlsB [43 kb]) coding for three polyketide synthases. The loading modules (labeled LM) and the 16 repeated modules depicted in purple (labeled 1–9 for mlsA1 and mlsA2, and 1–7 for mlsB) enable the serial buildup of the backbone carbon chain of the complex immunosuppressive substance mycolactone.

Comparison of the genes in multiple genomes can be represented visually by using a 3D program. Each arrow represents one gene, and the grey shading between genes indicates homology. Red indicates genes that are unique to one genome. The difference between this approach and existing programs is that all genomes can be compared to each other simultaneously, rather than by pairwise comparisons. With multiple genomes, and with zooming, flipping, and selecting options, even this rudimentary 3D program would be of great help in genome analysis.

Improved models and visualization tools are needed to analyze recombination. Virulence genes, here exemplified by the acfD gene in the Vibrio cholerae pathogenicity island , often display complex recombination patterns. The aligned acfD genes (arrows) from three V. cholerae strains (M2140, M1567, and M1118) are plotted separately; a line connects each site where the nucleotides in two strains differ from the third strain. Noninformative sites were removed before plotting.
Similar articles
-
Detection of a community infection outbreak with virtual surveillance.Lancet. 2003 Nov 8;362(9395):1587-8. doi: 10.1016/S0140-6736(03)14765-4. Lancet. 2003. PMID: 14615133 No abstract available.
-
Case definitions for diseases under national surveillance.Can Commun Dis Rep. 2000 May;26 Suppl 3:i-iv 1-122. Can Commun Dis Rep. 2000. PMID: 11055080 English, French. No abstract available.
-
The importance of public health genomics for ensuring health security for Australia.Med J Aust. 2019 Apr;210(7):295-297.e1. doi: 10.5694/mja2.50063. Epub 2019 Mar 19. Med J Aust. 2019. PMID: 30888069 No abstract available.
-
Surveillance systems reported in Communicable Diseases Intelligence, 2005.Commun Dis Intell Q Rep. 2005;29(1):90-4. Commun Dis Intell Q Rep. 2005. PMID: 15966684 Review. No abstract available.
-
Emerging Concepts and Technologies for the Discovery of Microorganisms Involved in Human Disease.Annu Rev Pathol. 2017 Jan 24;12:217-244. doi: 10.1146/annurev-pathol-012615-044305. Epub 2016 Dec 5. Annu Rev Pathol. 2017. PMID: 27959634 Review.
Cited by
-
Genomics of emerging infectious disease: A PLoS collection.PLoS Biol. 2009 Oct;7(10):e1000224. doi: 10.1371/journal.pbio.1000224. Epub 2009 Oct 26. PLoS Biol. 2009. PMID: 19855830 Free PMC article. No abstract available.
-
Application of two-part statistics for comparison of sequence variant counts.PLoS One. 2011;6(5):e20296. doi: 10.1371/journal.pone.0020296. Epub 2011 May 23. PLoS One. 2011. PMID: 21629788 Free PMC article.
-
inTB - a data integration platform for molecular and clinical epidemiological analysis of tuberculosis.BMC Bioinformatics. 2013 Aug 30;14:264. doi: 10.1186/1471-2105-14-264. BMC Bioinformatics. 2013. PMID: 24001185 Free PMC article.
-
Rise and demise of bioinformatics? Promise and progress.PLoS Comput Biol. 2012;8(4):e1002487. doi: 10.1371/journal.pcbi.1002487. Epub 2012 Apr 26. PLoS Comput Biol. 2012. PMID: 22570600 Free PMC article.
-
A review on computational systems biology of pathogen-host interactions.Front Microbiol. 2015 Apr 9;6:235. doi: 10.3389/fmicb.2015.00235. eCollection 2015. Front Microbiol. 2015. PMID: 25914674 Free PMC article. Review.
References
-
- Marra MA, Jones SJ, Astell CR, Holt RA, Brooks-Wilson A, et al. The genome sequence of the SARS-associated coronavirus. Science. 2003;300:1399–1404. - PubMed
-
- Rota PA, Oberste MS, Monroe SS, Nix WA, Campagnoli R, et al. Characterization of a novel coronavirus associated with severe acute respiratory syndrome. Science. 2003;300:1394–1399. - PubMed
-
- Parkhill J, Wren BW, Thomson NR, Titball RW, Holden MT, et al. Genome sequence of Yersinia pestis, the causative agent of plague. Nature. 2001;413:523–527. - PubMed
Publication types
MeSH terms
LinkOut - more resources
Full Text Sources
Medical
