. 2009 Oct 26;4(10):e7542.
doi: 10.1371/journal.pone.0007542.

miR-143 interferes with ERK5 signaling, and abrogates prostate cancer progression in mice

Affiliations

miR-143 interferes with ERK5 signaling, and abrogates prostate cancer progression in mice

Cyrielle Clapé et al. PLoS One. .

Abstract

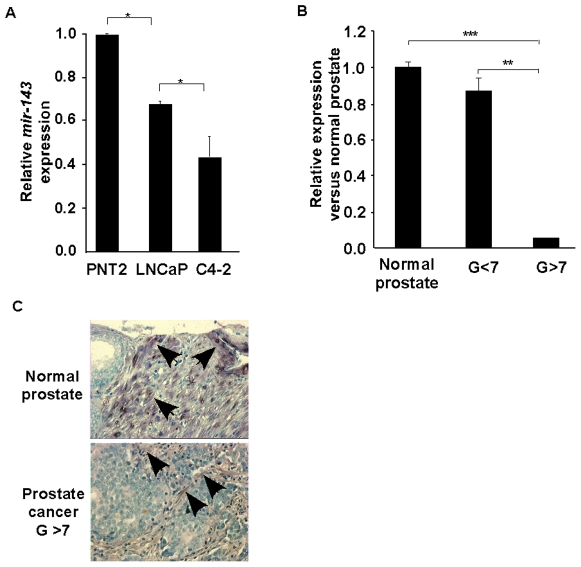
Background: Micro RNAs are small, non-coding, single-stranded RNAs that negatively regulate gene expression at the post-transcriptional level. Since miR-143 was found to be down-regulated in prostate cancer cells, we wanted to analyze its expression in human prostate cancer, and test the ability of miR-43 to arrest prostate cancer cell growth in vitro and in vivo.

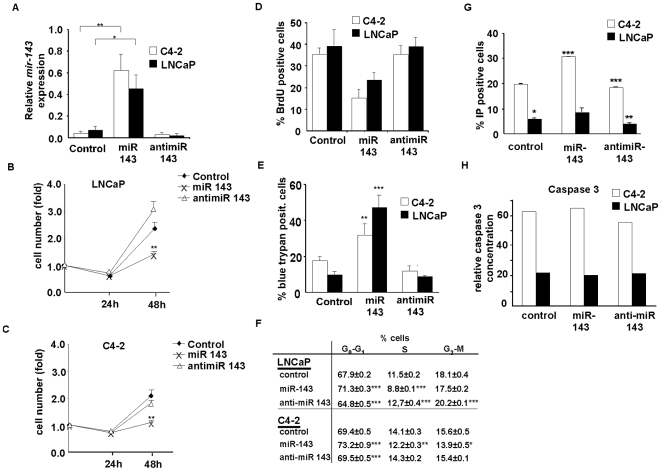
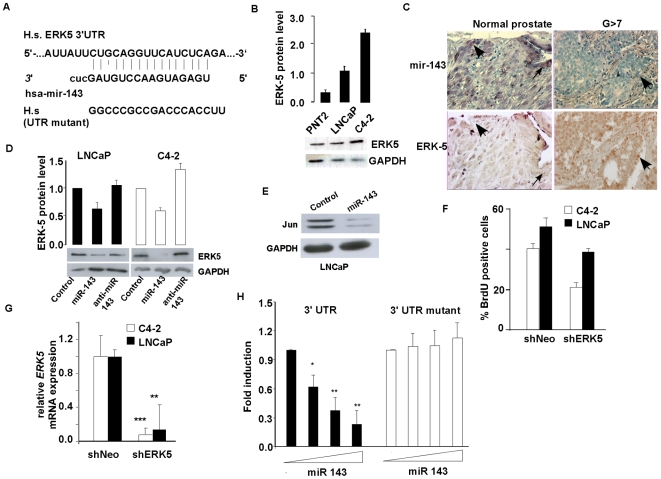
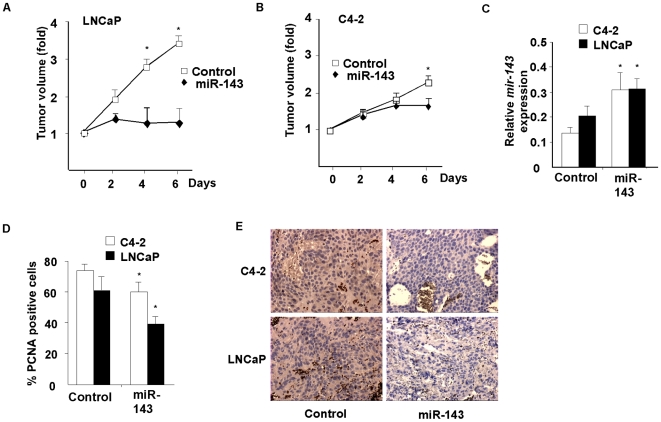
Results: Expression of miR-143 was analyzed in human prostate cancers by quantitative PCR, and by in situ hybridization. miR-143 was introduced in cancer cells in vivo by electroporation. Bioinformatics analysis and luciferase-based assays were used to determine miR-143 targets. We show in this study that miR-143 levels are inversely correlated with advanced stages of prostate cancer. Rescue of miR-143 expression in cancer cells results in the arrest of cell proliferation and the abrogation of tumor growth in mice. Furthermore, we show that the effects of miR-143 are mediated, at least in part by the inhibition of extracellular signal-regulated kinase-5 (ERK5) activity. We show here that ERK5 is a miR-143 target in prostate cancer.

Conclusions: miR-143 is as a new target for prostate cancer treatment.


Conflict of interest statement

Competing Interests: The authors have declared that no competing interests exist.

Figures

Figure 1
Figure 1. Expression of miR-143 in prostate cancer.
A, Quantitative real-time PCR (QPCR) of miR-143, normalized to the amount of RNU48 target in prostate cancer cell lines. The relative levels of miRNA expression were measured by determining the ΔCt values of the indicated cell line versus PNT2 cells. Data are means ± SEM for three independent experiments. Statistical significance, here and in subsequent figures, *<0,05; **<0,01; ***<0,001. B, QPCR of miR-143, normalized to the amount of RNU48 target in prostate tissue samples. The relative levels of miRNA expression were measured by determining the ΔCt values of the indicated gleason prostate cancer versus normal prostate. Data are means ± SEM of eleven prostate samples for each group. C, Representative in situ hybridization staining of miR-143 in human non-tumor and tumor prostate tissue. TMA presents 40 prostate cancer tissues vs. 10 normal prostate tissues. (TMA, magnification, 400×).
Figure 2
Figure 2. miR-143 overexpression in C4-2 cells and LNCaP cells.
A, QPCR of miR-143 in C4-2 cells (white bars) and LNCaP cells (black bars), normalized to RNU48 48 h after transfection with scrambled miR (control), miR-143 precursor or antimiR-143. Data are means ± SEM for five independent experiments. B–C, Cell growth in LNCaP (B) or C4-2 (C) cells during 48 h after transfection with scrambled miR (black rhombus), miR-143 precursor (black cross) or antimiR-143 (white triangle). Data are means ± SEM for three independent experiments. D, Quantification of BrdU incorporation 48 h after transfection in C4-2 and LNCaP cells in absence of miR-143 (top), in presence of miR-143 (middle) or antimiR-143 (bottom). Data are representative for three independent experiments. E, Blue trypan incorporation in C4-2 (white bars) and LNCaP (black bars) cells 48 h after transfection in absence or presence of miR-143 or in presence of antimiR-143. F, Percentage of cells in different phases of cell cycle in LNCaP and C4-2 cell lines 36 hours following transfection with control 5 (non relevant), miR-143 or antimiR-143. Similar results were obtained in two independent experiments. Results are expressed as mean ± sem (n = 2–4). G, FACS analysis of apoptosis in C4-2 (white bars) and LNCaP (black bars) cells 48 h after transfection in absence or presence of miR-143 or in presence of antimiR-143. H, Relative active Caspase 3 concentration in C4-2 (white bars) and LNCaP (black bars) cells 48 h after transfection in absence or presence of miR-143 or in presence of antimiR-143. The concentration of active caspases 3 is normalized with the global protein concentration.
Figure 3
Figure 3. Identification of ERK5 as a miR-143 target.
A, Schematic representation of the predicted target site of miR-143 in the 3′ UTR of ERK5 mRNA. Seed-matching sequence is indicated. H.s ERK5 3′UTR is the Homo Sapiens 3′UTRsequence. B, Western blot analysis of endogenous ERK5 expression in prostate normal and cancer cell lines. The relative expressions, normalized to GAPDH, were measured by Image J software as a fold of the indicated situation versus scrambled miR. Data are means ± SEM for three independent experiments. C, Representative immunohistochemical staining of ERK5, and in situ hybridization of miR-143 in consecutive sections of high-density tissue array. D, Western blot analysis of endogenous ERK5 expression in C4-2 and LNCaP cells 48 h after transient transfection of the indicated miR-143. Relative expression, quantified by Image J software is normalized to GAPDH, and measured by fold of the indicated situation versus scrambled miR. Data are means ± SEM for three independent experiments. E, Measure of the luciferase activity in COS cells transfected with a reporter luciferase gene pGL3 fused to the ERK-5 3′ UTR mutated or not with increasing concentrations or miR-143 (0; 25; 50; 100 nM). Values are normalized to beta-galactosidase activity and expressed in fold versus absence of miR-143. Black bars, ERK5 3′UTR, white bars, mutant 3′ UTR; data are means ±SEM for four experiments conducted in triplicate. F, Western blot analysis of endogenous c-Jun expression in LNCaP cells 48 h after transient transfection of the indicated miR-143. Data are representative for three independent experiments. G, QPCR of ERK5 in C4-2 cells (white bars) and LNCaP cells (black bars), normalized to 18 s gene 48 h after transfection with pSuper-shNeo (control) or pSuper-shERK5. Data are means ± SEM for three independent experiments. H, Quantification of BrdU incorporation in C4-2 cells (white bars) and LNCaP cells (black bars) 48 after transfection with pSuper-shNeo (control) or pSuper-shERK5. Data are representative for three independent experiments.
Figure 4
Figure 4. Effects of miR-143 rescue in mice model of prostate tumors.
A–B, Tumor growth of LNCaP (A) or C4-2 (B) cells injected subcutaneously and electroporated three times with non-relevant miR (control, white squared) or miR-143 precursor (black rhombus). Data are means ± SEM for seven mice analyzed per each group. C, QPCR analysis of miR-143 expression in C4-2 (white bars) and LNCaP xenografts (black bars), normalized to RNU48. Data are means ± SEM for seven mice analyzed per each group. D, Analysis of cell proliferation by PCNA staining on xenograft sections of athymic Nude mice injected subcutaneously with C4-2 (white bars) or LNCaP (black bars) cells after three electroporations with scrambled miR or miR-143 precursor. Data are means ± SEM for seven mice analyzed per each group. E, Representative immunohistological staining of ERK5 in C4-2 and LNCaP tumors. Nude mice injected subcutaneously with C4-2 (white bars) or LNCaP (black bars) cells after three electroporations with scrambled miR or miR-143 precursor. Data are representative for seven mice analyzed per each group. (magnification, 400×).

References

    1. Huggins C. Endocrine-induced regression of cancers. Science. 1967;156:1050–1054. - PubMed
    1. Feldman BJ, Feldman D. The development of androgen-independent prostate cancer. Nat Rev Cancer. 2001;1:34–45. - PubMed
    1. Lim LP, Lau NC, Garrett-Engele P, Grimson A, Schelter JM, et al. Microarray analysis shows that some microRNAs downregulate large numbers of target mRNAs. Nature. 2005;433:769–773. - PubMed
    1. He L, Hannon GJ. MicroRNAs: small RNAs with a big role in gene regulation. Nat Rev Genet. 2004;5:522–531. - PubMed
    1. Thum T, Gross C, Fiedler J, Fischer T, Kissler S, et al. MicroRNA-21 contributes to myocardial disease by stimulating MAP kinase signalling in fibroblasts. Nature. 2008;456:980–984. - PubMed

Publication types