. 2009 Oct 27;3(10):2941-52.
doi: 10.1021/nn900947a.

Simultaneous enhancement of photothermal stability and gene delivery efficacy of gold nanorods using polyelectrolytes

Affiliations

Simultaneous enhancement of photothermal stability and gene delivery efficacy of gold nanorods using polyelectrolytes

Huang-Chiao Huang et al. ACS Nano. .

Erratum in

  • ACS Nano. 2010 Mar 23;4(3):1769-70

Abstract

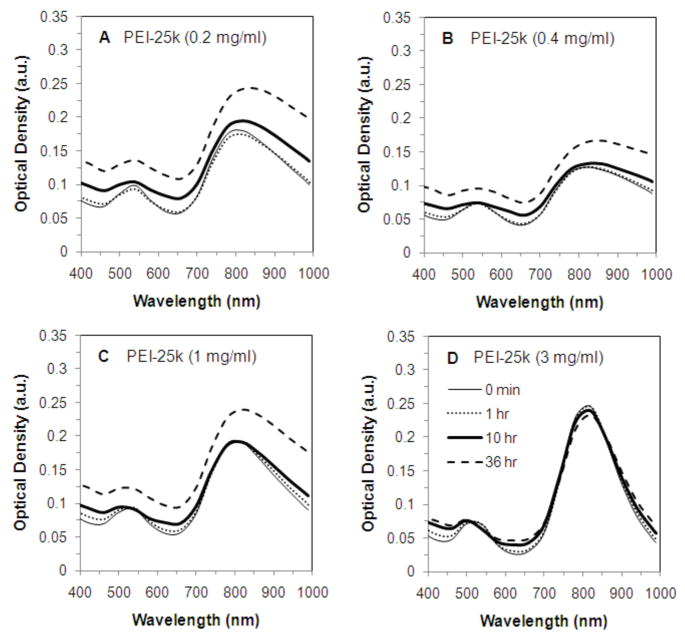
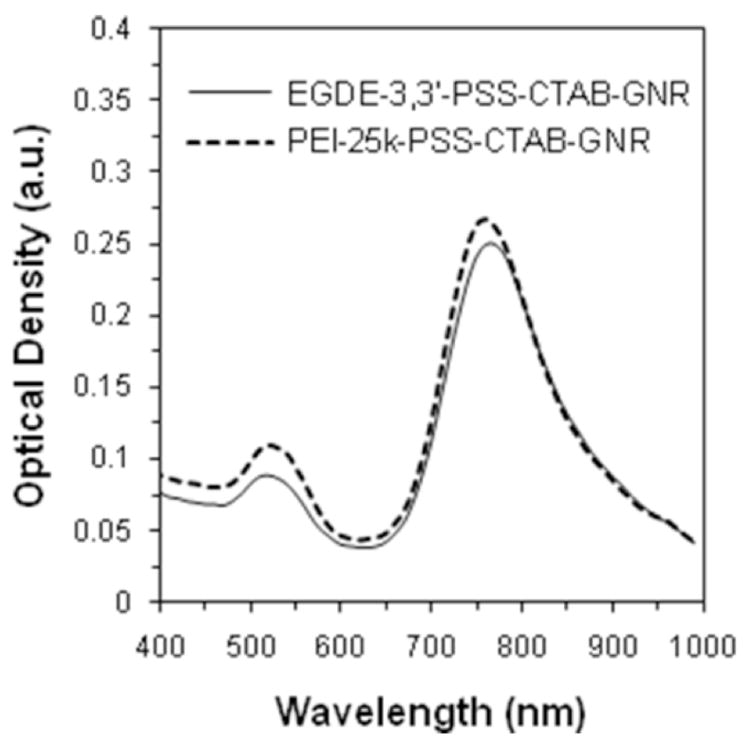
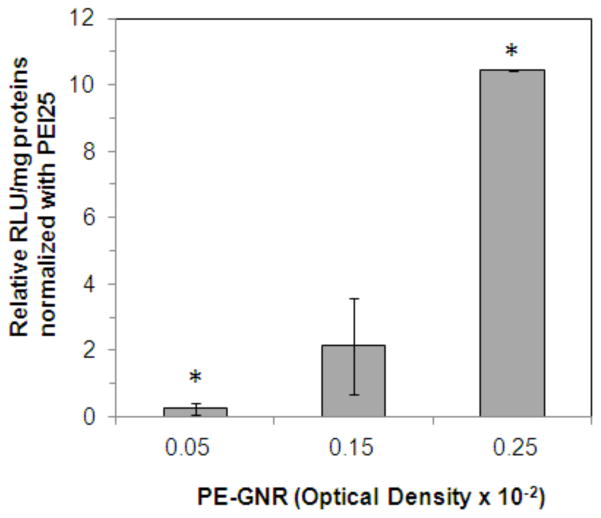
The propensity of nanoparticles to aggregate in aqueous media hinders their effective use in biomedical applications. Gold nanorods (GNRs) have been investigated as therapeutics, imaging agents, and diagnostics. We report that chemically generated gold nanorods rapidly aggregate in biologically relevant media. Depositing polyelectrolyte multilayers on gold nanorods enhanced the stability of these nanoparticles for at least up to 4 weeks. Dispersions of polyelectrolyte (PE)-gold nanorod assemblies (PE-GNRs) demonstrate a stable Arrhenius-like photothermal response, which was exploited for the hyperthermic ablation of prostate cancer cells in vitro. Subtoxic concentrations of PE-GNR assemblies were also employed for delivering exogenous plasmid DNA to prostate cancer cells. PE-GNRs based on a cationic polyelectrolyte recently synthesized in our laboratory demonstrated higher transfection efficacy and lower cytotoxicity compared to those based on polyethyleneimine, a current standard for polymer-mediated gene delivery. Our results indicate that judicious engineering of biocompatible polyelectrolytes leads to multifunctional gold nanorod-based assemblies that combine high stability and low cytotoxicity with photothermal ablation, gene delivery, and optical imaging capabilities on a single platform.


Figures

FIGURE 1
FIGURE 1
Short-term optical stability of CTAB-gold nanorods (CTAB-GNRs) dispersed in different biologically relevant media. CTAB-GNRs, optical density 0.5 at 800 nm, were centrifuged once and resuspended in same volume of (A) deionized or DI water, (B), phosphate-buffered saline (PBS) (C) serum-free medium, and (D) serum-containing medium. Absorbance spectra were monitored from 400 nm to 999 nm for up to 48 h in respective media.
FIGURE 2
FIGURE 2
Long-term UV-visible spectrums of CTAB-GNRs dispersed in different biologically relevant media. CTAB-GNRs, optical density 0.5 at 800 nm were centrifuged three times and resuspended in same volume of (A) deionized water, (B) PBS and (C) serum-free medium, and (D) serum-containing medium. Spectra were measured immediately following preparation (“Week 0”), 1, 2, and 4 weeks after preparation. Similar results were seen with GNRs with a maximal absorption peak at 750 nm.
FIGURE 3
FIGURE 3
Stability of (i) EGDE3,3′-PSS-CTAB-GNRs, (ii) pEI25-PSS-CTAB-GNRs in serum free media as monitored by the transverse and longitudinal absorption peaks. CTAB nanorods were coated with the anionic polyelectrolyte PSS (2mg/ml), followed by coating with different concentrations of cationic polyelectrolytes, (i) EGDE-3,3′ and (ii) pEI25. In panel (i), (A) 0 mg/ml, (B) 0.2 mg/ml, (C) 1 mg/ml, and (D) 3 mg/ml EGDE-3,3′ polymer. In panel (ii), (A) 0.2 mg/ml, (B) 0.4 mg/ml, (C) 1 mg/ml, and (D) 3 mg/ml, pEI-25k polymer. The absorption spectra of polyelectrolyte-coated GNRs were monitored for up to 36 h using a temperature-controlled plate reader. See Experimental section for details.
FIGURE 3
FIGURE 3
Stability of (i) EGDE3,3′-PSS-CTAB-GNRs, (ii) pEI25-PSS-CTAB-GNRs in serum free media as monitored by the transverse and longitudinal absorption peaks. CTAB nanorods were coated with the anionic polyelectrolyte PSS (2mg/ml), followed by coating with different concentrations of cationic polyelectrolytes, (i) EGDE-3,3′ and (ii) pEI25. In panel (i), (A) 0 mg/ml, (B) 0.2 mg/ml, (C) 1 mg/ml, and (D) 3 mg/ml EGDE-3,3′ polymer. In panel (ii), (A) 0.2 mg/ml, (B) 0.4 mg/ml, (C) 1 mg/ml, and (D) 3 mg/ml, pEI-25k polymer. The absorption spectra of polyelectrolyte-coated GNRs were monitored for up to 36 h using a temperature-controlled plate reader. See Experimental section for details.
FIGURE 4
FIGURE 4
Long term UV-visible spectra of polyelectrolyte–coated gold nanorods (PE-GNRs) dispersed in serum-free media and serum-containing media. EGDE3.3′-PSS-CTAB-GNRs (λmax = 770 nm) dispersed in serum-free media (A) and serum-containing media (C); pEI25k-PSS-CTAB-GNRs dispersed in serum-free media (B) and serum-containing media (D).
FIGURE 5
FIGURE 5. Cytotoxicity of polyelectrolyte-coated gold nanorods (PE-GNRs)
(i) Absorption spectra of PE-coated nanorods employed in the cytotoxicity analysis. (ii) Phase contrast and fluorescence microscopy images that show the cytotoxicity of EGDE-3,3′-PSS-GNRs, toward PC3-PSMA cells. Red fluorescent ethidium homodimer, which stains DNA in compromised nuclei, was used to determine cytotoxicity following 6 h treatment. A total of 10, 25, 50, 75 and 100 μl of EGDE-3,3′-PSS-CTAB-GNRs (optical density = 0.25), were added to cells. The final volume in each well was brought up to 500 μl, resulting in final optical densities of A: 0.005, B: 0.0125, C: 0.025, D: 0.0375, and E: 0.05. Scale bar: 500 μm (iii) Phase contrast and fluorescence microscopy images that show the cytotoxicity of pEI25-PSS GNRs. A 5 μl (O.D.=0.0025), B 10 μl (O.D.=0.005), C 15 μl (O.D.=0.0075), D 20 μl (O.D.=0.01), and E 25 μl (O.D.=0.0125), of pEI25-PSS-GNRs. Other conditions are similar to those described above. Scale bar: 500 μm (iv) Comparison of cytotoxicity of pEI25-PSS-CTAB-GNRs and EGDE3,3′-PSS-CTAB-GNRs as a function of PE-GNR optical density.
FIGURE 6
FIGURE 6
Photothermal response of EGDE3,3′-PSS-CTAB-GNRs in serum-free media. Different concentrations (as determined by their optical densities) of nanorods were irradiated with continuous wavelength (CW) laser at 770nm (20 W/cm2) for a maximum of fifteen minutes. The temperature of the dispersion was monitored using a K-thermocouple. The steady-state temperatures showed an increase of approximately10oC with a doubling of nanorod concentration indicating Arrhenius-like behavior.
FIGURE 7
FIGURE 7. Photothermal Ablation of PC3-PSMA human prostate cancer cells using EGDE3,3′-PSS-CTAB-GNRs
(i) Absorbance spectrum of EGDE3,3′-PSS-CTAB-GNRs used in the photothermal ablation studies. (ii) Phase contrast images (A, C, E, G) and fluorescence microscopy images (B, D, F, H) of PC3-PSMA cells treated as described below; red fluorescence is due to ethidium homodimer staining of compromised nuclei. Scale bar: 200 μm A, B: EGDE3,3′-PSS-CTAB-GNRs + laser (7 minutes; power density: 20 W/cm2) C, D: EGDE3,3′-PSS-CTAB-GNRs (without laser treatment) E, F: laser alone (no nanorods) G, H: No treatment (iii). Photothermal ablation of PC3-PSMA cells using EGDE3,3′-PSS-CTAB-GNR (PE-GNR) assemblies (O.D.= 0.1) as a function of laser power density.
FIGURE 8
FIGURE 8
Transfection of PC3-PSMA human prostate cancer cells using EGDE3,3′-PSS-CTAB-GNRs and pEI25-PSS-CTAB-GNRs. PC3-PSMA cells were treated with different concentrations of PE-GNRs containing 350 ng pGL3 plasmid for 6 h. Luciferase expression, in relative luminescence units or RLU was analyzed 48 h following transfection and normalized to protein content in each case (RLU/mg). The normalized luciferase expression for EGDE3,3′-PSS-CTAB-GNRs is reported relative to that for pEI25-PSS-CTAB-GNRs. CTAB-GNRs did not demonstrate any transfection activity at similar optical densities. Asterisks indicate p values < 0.02 determined using two-tailed Student’s t-test for a minimum of three independent experiments.

References

    1. Jabr-Milane L, van Vlerken L, Devalapally H, Shenoy D, Komareddy S, Bhavsar M, Amiji M. Multi-functional nanocarriers for targeted delivery of drugs and genes. J Control Release. 2008;130:121–128. - PubMed
    1. Smith AM, Duan H, Mohs AM, Nie S. Bioconjugated quantum dots for in vivo molecular and cellular imaging. Adv Drug Deliv Rev. 2008;60:1226–1240. - PMC - PubMed
    1. Cho K, Wang X, Nie S, Chen ZG, Shin DM. Therapeutic nanoparticles for drug delivery in cancer. Clin Cancer Res. 2008;14:1310–1316. - PubMed
    1. Medintz IL, Mattoussi H, Clapp AR. Potential clinical applications of quantum dots. Int J Nanomedicine. 2008;3:151–167. - PMC - PubMed
    1. Heath JR, Davis ME. Nanotechnology and cancer. Annu Rev Med. 2008;59:251–265. - PMC - PubMed

Publication types