. 2009 Nov 23;206(12):2779-93.
doi: 10.1084/jem.20091107. Epub 2009 Oct 26.

Identity of the elusive IgM Fc receptor (FcmuR) in humans

Affiliations

Identity of the elusive IgM Fc receptor (FcmuR) in humans

Hiromi Kubagawa et al. J Exp Med. .

Abstract

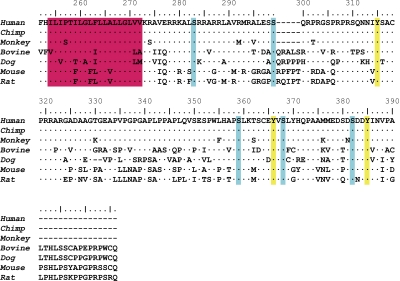
Although Fc receptors (FcRs) for switched immunoglobulin (Ig) isotypes have been extensively characterized, FcR for IgM (FcmuR) has defied identification. By retroviral expression and functional cloning, we have identified a complementary DNA (cDNA) encoding a bona fide FcmuR in human B-lineage cDNA libraries. FcmuR is defined as a transmembrane sialoglycoprotein of approximately 60 kD, which contains an extracellular Ig-like domain homologous to two other IgM-binding receptors (polymeric Ig receptor and Fcalpha/muR) but exhibits an exclusive Fcmu-binding specificity. The cytoplasmic tail of FcmuR contains conserved Ser and Tyr residues, but none of the Tyr residues match the immunoreceptor tyrosine-based activation, inhibitory, or switch motifs. Unlike other FcRs, the major cell types expressing FcmuR are adaptive immune cells, including B and T lymphocytes. After antigen-receptor ligation or phorbol myristate acetate stimulation, FcmuR expression was up-regulated on B cells but was down-modulated on T cells, suggesting differential regulation of FcmuR expression during B and T cell activation. Although this receptor was initially designated as Fas apoptotic inhibitory molecule 3, or TOSO, our results indicate that FcmuR per se has no inhibitory activity in Fas-mediated apoptosis and that such inhibition is only achieved when anti-Fas antibody of an IgM but not IgG isotype is used for inducing apoptosis.


Figures

Figure 1.
Figure 1.
Isolation of IgM-binding subclones and identification of cDNA inserts. (A) Cells transduced by the retroviral expression construct containing CLL-derived (top) or PMA-activated 697 pre–B cell–derived (bottom) cDNA libraries were enriched for IgM binding by FACS and subcloned for limiting dilution. Three representative subclones from each library are shown for their IgM-binding activity or lack of binding, as determined by flow cytometry. (B) Agarose gel electrophoresis analysis of RT-PCR products. RNA isolated from nontransduced control BW5147 T cells (lane 1) and from IgM-binding (lanes 3–5 and 7–9) or IgM-nonbinding (lanes 2 and 6) subclones from CLL-derived (lanes 2–5) and PMA-activated 697 pre–B cell–derived (lanes 6–9) cDNA libraries were subjected to RT-PCR as described in Materials and methods. Amplified products were electrophoresed in 0.7% agarose and stained with ethidium bromide. Lane 10 is a PCR control without a first-strand cDNA template. HindIII-digested λ DNA was used as a size marker. The experiments were performed once for A and twice for B.
Figure 2.
Figure 2.
Evaluation of the Ig isotype specificity of the FcμR. (A) FcμR cDNA–transduced BW5147 T cells were preincubated with various concentrations of inhibitor paraproteins of human origin (IgM, IgG1-4, IgA1-2, IgD, IgE, Fabμ, and Fc5μ) and incubated with 4 µg/ml of biotin-labeled human IgMκ. Bound biotinylated IgM was detected by addition of PE-labeled SA. Stained cells were analyzed by flow cytometry. Results are expressed as the percent mean fluorescence intensity (MFI) estimated as follows: 100 × ([X of IgM binding with inhibitors − X of background control]/[X of IgM binding without inhibitors − X of background control]), where X indicates the MFI values. Because there were no significant differences among each subclass of IgG and IgA, the results from all four IgG subclasses and two IgA subclasses have been combined as IgG and IgA, and the mean values are presented for simplicity. (B) Representative binding inhibition profiles. FcμR+ BW5147 T cells were incubated first with an eightfold excess of the indicated inhibitor proteins and then with 4 µg/ml of biotin-labeled human IgMκ. The dotted, dashed, and continuous lines indicate the immunofluorescence profiles for background controls, IgM binding without inhibitors, and IgM binding with the test inhibitors, respectively. (C) Control and FcμR+ BW5147 cells were incubated with culture supernatants containing the indicated concentrations of monomeric (m) or pentameric (p) IgM anti–mouse RBC mAb before developing with biotin-labeled anti–mouse κ mAb and APC-SA. These experiments were performed at least twice.
Figure 3.
Figure 3.
aa sequence alignment of IgM-binding receptors. The Ig-binding domains of pIgR, Fcα/μR, and FcμR from several species were aligned using the CLUSTAL W multiple alignment program (Thompson et al., 1994). aa identity is indicated by dots and gaps are indicated by dashes. Residues conserved in all three receptors and in pIgR and Fcα/μR are highlighted in yellow and red, respectively. The numbers indicate the aa position from the N terminus of the Ig-binding domain of human pIgR. These sequences are available from GenBank/EMBL/DDBJ under the following accession nos.: pIgR of human (hu; P01833), rabbit (rb; P01832), mouse (mo; O70570), rat (rt; P15083), bovine (bo; P81265), and chicken (ch; AAP69798); Fcα/μR of human (AAL51154) and mouse (NP_659209); and FcμR of human (NP_005440), chimpanzee (cm; XP_001165341), monkey (mn; XP_001084243), bovine (XP_588921), dog (do; XP_547385), mouse (NP_081252), and rat (Q5M871).
Figure 4.
Figure 4.
aa sequence alignment of the transmembrane and cytoplasmic regions of FcμRs. aa sequences of the transmembrane segments and cytoplasmic tails of FcμR from seven different species are aligned. aa identity is indicated by dots, and a deletion is indicated by dashes. The predicted transmembrane region is highlighted in red. Conserved serine and tyrosine residues are also highlighted in blue and yellow, respectively. The numbers indicate the aa position from the first Met residue of human FcμR. The GenBank/EMBL/DDBJ accession nos. for these FcμRs are the same as those in Fig. 3. Chimp, chimpanzee.
Figure 5.
Figure 5.
Tyrosine and serine phosphorylation of FcμR upon stimulation. (A and B) BW5147 T cells stably expressing human FcμR were incubated in the presence (+) or absence (−) of 100 µM pervanadate for 15 min (A) or with the preformed IgM immune complexes for the indicated time periods (min) at 37°C (B) before cell lysis. FcμR was immunoprecipitated from cleared lysates with anti-FcμR (HM14) or control (Cont.) mAb–coupled beads, resolved on SDS–10% PAGE under reducing conditions, transferred onto membranes, and immunoblotted with rabbit antibody specific for phosphoserine of PKC substrates along with HRP-labeled goat anti–rabbit Ig antibody (anti-PKC P-Ser) or with HRP-labeled antiphosphotyrosine mAb (anti–P-Tyr) before visualization by ECL. After dissociating blotted antibodies, membranes were reprobed with biotin-labeled anti-FcμR mAbs along with HRP-labeled SA (anti-FcμR). These experiments were performed at least three times. Mr is shown in kilodaltons.
Figure 6.
Figure 6.
Role of FcμR in Fas-mediated apoptosis of Jurkat T cells. (A) Jurkat cells transduced without (none) or with the bicistronic retroviral construct containing GFP cDNA only (GFP) or both FcμR and GFP cDNAs (FcμR/GFP) were incubated with biotin-labeled isotype-matched control mAb (left), HM14 anti-FcμR mAb (middle), or human IgM (right), and then with APC-SA before analysis by FACSCalibur. Note the comparable levels of GFP in both GFP and FcμR/GFP transductants, and the expression of FcμR on the FcμR/GFP transductant as determined by anti-FcμR reactivity and IgM ligand binding. (B) These three cell lines were incubated at 37°C for 24 h with agonistic anti–human Fas mAbs of mouse IgMκ (CH11 clone; 10 ng/ml) or IgG3κ isotype (2R2 clone; 0.3 µg/ml). Cells were stained with 7-AAD and APC-labeled annexin V before identification of early (annexin V+/7-AAD) and late (annexin V+/7-AAD+) apoptotic and dead (annexin V/7-AAD+) cells by FACSCalibur. Note the resistance of FcμR/GFP transductant to IgM but not IgG3 anti-Fas mAb–induced apoptosis. Numbers indicate percentages of cells. These experiments were performed more than three times.
Figure 7.
Figure 7.
Biochemical characterization of FcμR molecules. (A and B) GPI-PLC treatments. BW5147 T cells stably expressing human FcμR (A) and PMA-activated 697 pre–B cells (B) were incubated with PBS (blue) or 10 U/ml GPI-PLC (red) for 30 min at 30°C, and then examined for the expression of FcμR by anti-FcμR mAb or IgM ligand binding along with the expression of Thy-1 and CD11a (A) or of CD73 (ecto-5′-nucleotidase) and CD19 (B). A control sample was kept on ice during this treatment without GPI-PLC (green). Note the significant reduction in MFI of Thy-1 and CD73 but not of CD11a, CD19, FcμR, and IgM-binding profiles after GPI-PLC treatment. (C) SDS-PAGE analysis of cell-surface proteins. Plasma membrane proteins on control (BW) and FcμR-bearing BW5147 T cells (FcμR) were labeled with biotin, quenched, and incubated with mouse γ1κ control (Cont.) or anti-FcμR (HM14) mAbs or mouse IgMκ ligand before washing and solubilization in 1% NP-40 lysis buffer containing protease inhibitors. The mAb-bound cell-surface proteins were captured by addition of beads coupled with rat anti–mouse κ mAb (187.1 clone) and resolved on SDS–10% PAGE under nonreducing (not depicted) and reducing conditions, followed by transfer onto membranes, blotting with HRP-SA, and visualization by ECL. The same results were obtained with the HM7 anti-FcμR mAbs. The arrow indicates FcμR. The experiments were performed 3 times for A and B and >10 times for C.
Figure 8.
Figure 8.
Immunofluorescence analysis of cell-surface FcμR expression in various tissues. (A–D) MNCs from blood (A and B), tonsils (C), and bone marrow (D) were first incubated with aggregated human IgG to block FcγRs and then with biotin-labeled HM14 anti-FcμR mAb along with the appropriate fluorochrome-labeled mAbs specific for CD19, IgM, IgD, CD38, CD3, CD4, CD8, or CD56. For IgM ligand binding, mouse IgMκ and biotin-labeled rat anti–mouse κ mAbs were sequentially added to MNCs without preincubation with aggregated IgG. The bound biotin-labeled reagents were detected by addition of SA-PE. Essentially the same results were obtained with the HM7 anti-FcμR mAb (not depicted). Because the results of the FcμR expression by CD3+/CD8+ and CD3+/CD4 T cells were essentially the same, the CD8 data were omitted for simplicity. The cell populations indicated by the red boxes were gated and examined for their reactivity with the HM14 anti-FcμR mAb and IgM ligand. Biotin-labeled irrelevant mAbs of the γ1κ (for HM14) or γ2bκ (for HM7) isotype were used as controls. The analysis was performed with freshly prepared cell preparations (A and D; labeled Fresh) or with cells cultured overnight in IgM-free media (O/N; B and C). Because the immunofluorescence profiles of freshly prepared tonsillar B cells with anti-FcμR mAbs and isotype-matched control mAbs as well as these of overnight-cultured B cells with the isotype-matched control mAbs were all essentially the same, only the results of freshly prepared and overnight-cultured B cells with anti-FcμR mAbs are shown in C (top) for simplicity. CD19+ B cells in tonsils (C) were analyzed for FcμR expression as follicular/naive (IgD+/CD38), pregerminal center (preGC; IgD+/CD38+), germinal center (GC; IgD/CD38+), and memory (IgD/CD38) cells. The frequency (%) of FcμR+ cells in each cell type among 10 different blood samples was 62 ± 18 for CD19+ B cells, 62 ± 13 for CD4+ T cells, 43 ± 23 for CD8+ T cells, and 19 ± 11 for CD56+ NK cells (means ± SD). The frequencies (%) of FcμR+ cells over the background staining with isotype-matched control mAbs in three tonsillar samples were 31 ± 7 for follicular/naive, 15 ± 3 for preGC, 10 ± 3 for GC, and 30 ± 12 for memory B cells, and 34 ± 6 for CD4+ T and 51 ± 7 for CD8+ T cells (means ± SD). The experiments were performed >10 times for A and B, 3 times for C, and 2 times for D.

Similar articles

Cited by

References

    1. Arase H., Saito T., Phillips J.H., Lanier L.L. 2001. Cutting edge: the mouse NK cell-associated antigen recognized by DX5 monoclonal antibody is CD49b (α 2 integrin, very late antigen-2). J. Immunol. 167:1141–1144 - PubMed
    1. Basten A., Warner N.L., Mandel T. 1972. A receptor for antibody on B lymphocytes. II. Immunochemical and electron microscopy characteristics. J. Exp. Med. 135:627–642 10.1084/jem.135.3.627 - DOI - PMC - PubMed
    1. Baumgarth N., Herman O.C., Jager G.C., Brown L.E., Herzenberg L.A., Chen J. 2000. B-1 and B-2 cell–derived immunoglobulin M antibodies are nonredundant components of the protective response to influenza virus infection. J. Exp. Med. 192:271–280 10.1084/jem.192.2.271 - DOI - PMC - PubMed
    1. Bergmann-Leitner E.S., Leitner W.W., Tsokos G.C. 2006. Complement 3d: from molecular adjuvant to target of immune escape mechanisms. Clin. Immunol. 121:177–185 10.1016/j.clim.2006.07.001 - DOI - PubMed
    1. Boes M., Esau C., Fischer M.B., Schmidt T., Carroll M., Chen J. 1998a. Enhanced B-1 cell development, but impaired IgG antibody responses in mice deficient in secreted IgM. J. Immunol. 160:4776–4787 - PubMed

Publication types

MeSH terms